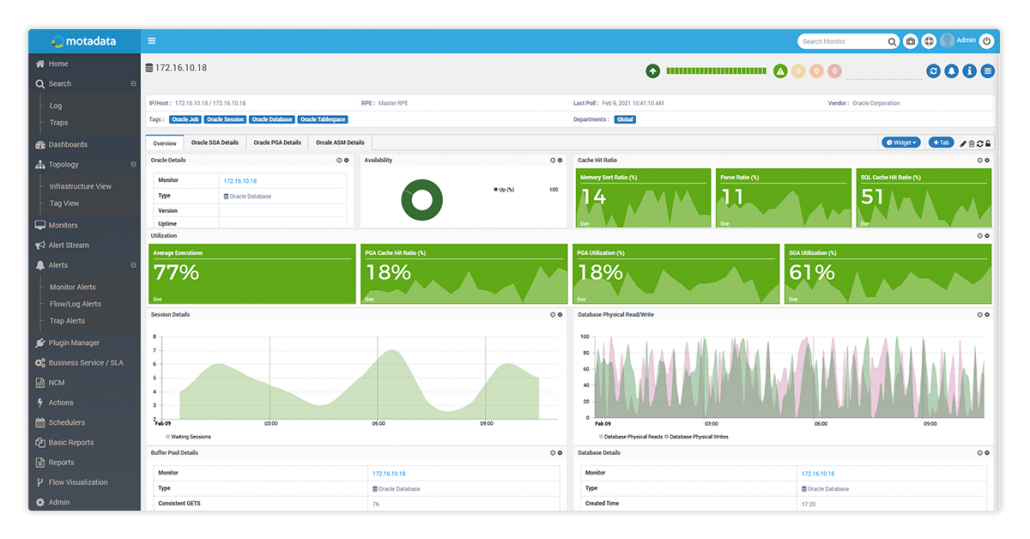
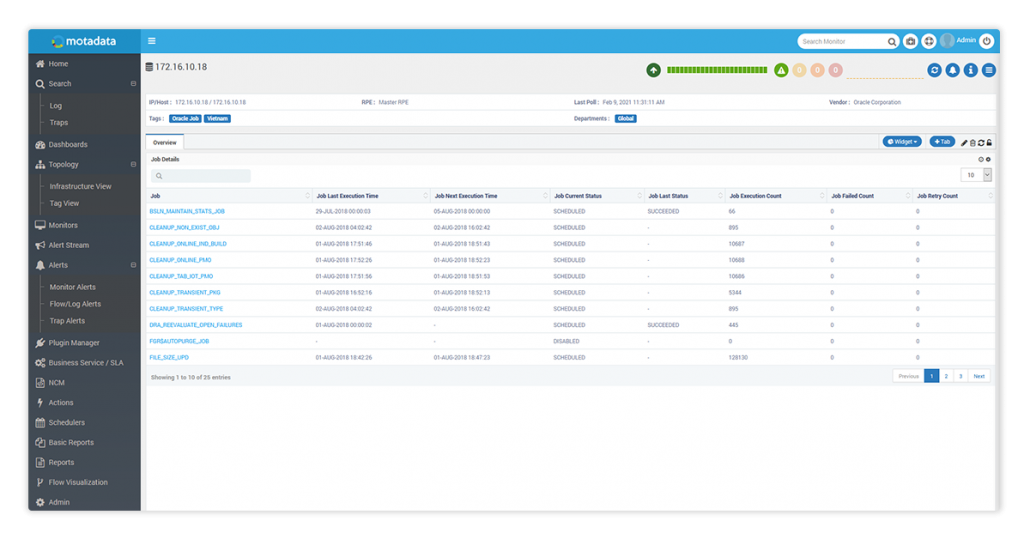
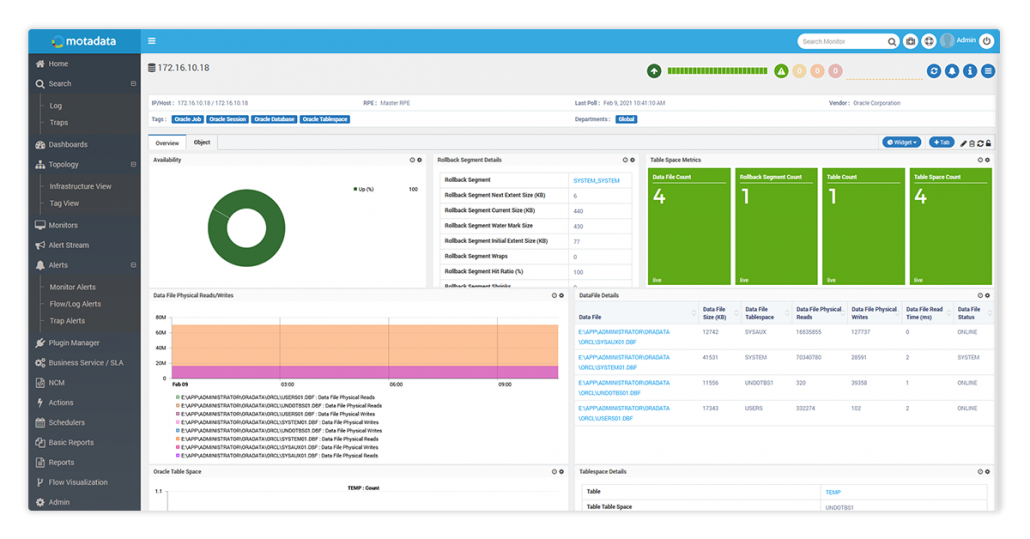
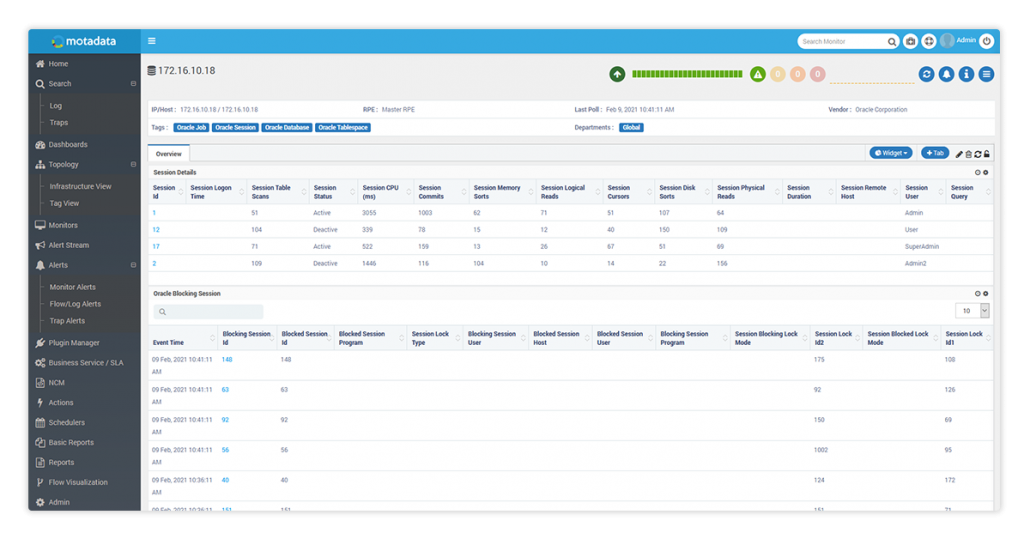
In general, databases are an integral part of the IT infrastructure. Availability of database servers is critical to any business.
It has become all the more crucial to keep a close eye on database’s availability and performance.
Efficient Database monitoring helps you to get deep insights on your server sessions, memory, buffer, latches and locks and lets you auto discover your servers in the network.
Storing, querying, and updating critical business data is the core essence.
Naturally, the availability, performance, and security of a database system are of primary concerns for any database administrator.
To facilitate this, system administrators typically resort to database monitoring solutions.
Here let us discuss essentially about the important questions around ORACLE DATABASE MONITORING.
- What do understand from monitoring your oracle database?
- What are key benefits of oracle database monitoring?
- What are the important oracle database metrics that needs to be monitored?
- What are the key insights gathered by using Motadata for monitoring your oracle database?
But before we delve deeper into each section, you must keep in mind that effective database management requires a great deal of expertise, and Oracle monitoring tools are critical for successful IT service delivery.
What do you understand from monitoring your oracle database?
Oracle database monitoring tracks down the usage & growth of Oracle tablespace which helps you ensure right provisioning of Oracle database tables.
It enables you to pin-point the root cause of poor database performance with automatic root cause analysis.
What’s more intriguing is the fact that it lets you keep an eye on critical monitoring metrics like assigned bytes & blocks, percent of free as well as used bytes, available blocks, read or write data, data file related details etc.
When it comes to analyzing the behavior of Oracle databases, base-lining is the approach of choice.
By comparing current performance to historical metrics, monitoring your oracle databases helps you recognize when performance is under par.
This approach provides you with continuous insights and detailed root-cause analysis when problems occur.
What are the key benefits of oracle database monitoring?
A well-rounded & effectively configured oracle database monitoring solution has a number of benefits. For instance:
- Predictive and Proactive monitoring is always better than a reactive approach. It’s always advisable to identify any red signals before they become major incidents: Troubleshoot it before it becomes a problem.
- When applications are down or they are operative enough but experience latency issues the first place people start investigating is the database. Having your oracle database monitoring in place can quickly highlight any possible issues and resolve those issues on priority basis.
- Database Monitoring is not only about paying attention to the performance metrics. It has more to it, like tracking security-related events, automatically checking backups and much more.
That being said it is very important to understand the underlying principles of building an effective oracle database monitoring strategy.
Being aware about these benefits here are top 3 parameters you must ensure to achieve the top oracle database performance:
- Queries that are long-running, I/O intensive and memory intensive are identified and optimized for fast application performance.
- Servers have enough buffers to perform and sort operations in memory rather than on disk.
- Query waits are identified and the database subsystem tuned to minimize wait times.
What are the important oracle database metrics that needs to be monitored?
For the ease of it, it is highly recommended to divide it into the following categories and exploring which oracle database metrics you should be monitoring.
- Infrastructure
- Throughput
- Performance
- Security
- Logs
Infrastructure
Infrastructure is an important use-case of oracle database monitoring that can be managed by the oracle database plugin. The metrics should include:
- Percent CPU time used by the oracle database process
- Available memory
- Available disk space
- Disk queue for waiting IO
- Percent virtual memory use
- Network bandwidth for inbound and outbound traffic
An important point to consider here is that if the metrics reach the optimal acceptable threshold, it becomes crucial to relate the values to the database metrics as well.
The reason being that the hardware like a full disk can reflect in poor query performance.
If we talk about cluster monitoring in database (Oracle RAC) some of the KPI’s which we aim to monitor:
- The overall system status, such as the number of nodes in the cluster and their current status.
- Health check for cluster ware.
- Monitoring the cluster ware alert log for OCR or voting disk related issues, node evictions, and other cluster ware errors.
- Monitoring the synchronization of the multiple instances.
A proactive oracle database monitoring tool should be able to present a single pane of glass view of the infrastructure at any time:
Throughput
It should be measured to create normal production performance baselines.
As baselines are built over a subsequent time period, they can be used to create acceptable thresholds for proactive notifications.
Any large deflection from the predefined values would call for troubleshoot and a detailed root-cause analysis.
The parameters which should be monitored while collecting the throughput metrics during different workloads as part of the oracle sessions and database plugin are:
- Connection wait time for database endpoints
- Number of active database connections
- Number of read queries received or in progress
- Number of insert, update, or delete commands received or in progress
- Average time to complete insert, update or delete commands
- Number of completed transactions
- Heap memory used
Performance
As part of the oracle job and sessions plugin performance counters for oracle database monitoring should be reported in a specific time scale. Some of the important parameters include:
- Connected/Active/Blocked Session durations
- Session Status
- Query Optimization Status
- Job Last Executed/Job Status
- Backup Job Query Optimization
A drill-down reported analysis is the best type of performance monitored by oracle database monitoring solution that ships with the database product.
Security
Oracle Database security monitoring needs to be in-line with the overall IT organization security constraints and standards. At the primary level as part of the oracle database plugin monitoring the following is important.
- Number of failed login attempts
- Database configuration modules
- New user account creation
- Password changes
Database Administrators should look at all the sessions and their aggregated vales. It often becomes a concern only when there are large deviations in those aggregated numbers.
With Oracle Data Guard, administrators can optionally improve production database performance by offloading resource-intensive backup and reporting operations to standby systems. To facilitate that some of the KPI’s that needs to be monitored are:
- Instance status and lag between primary and standby.
- Monitoring the progress of log transfer and log apply services.
- Checking the Data Guard Status, under what protection mode is Data Guard functioning such as Maximum Performance or Protection or availability Modes.
- Checking the current log sequence at primary database and what is the received and applied sequence on Standby database.
Logs
Log management is one of the core aspects of the oracle database monitoring because logs can contain insightful information such as:
- Database system events (startup, shutdown, errors, etc.)
- User/System queries
- Scheduled jobs’ outputs
The Oracle database monitoring tool as part of the oracle slow query log collector plugin should be able to collect, parse, and store these logs and create metrics and dashboards from the events they monitor.
What are the key insights gathered by using Motadata for monitoring your oracle database?
- By keeping tabs on your Oracle database sessions, you extract valuable data about the database server load.
- Using an Oracle monitoring tool like Motadata optimize your Oracle database with ease.
- With just one click you can get details regarding database sessions, active users, summary of sessions, and wait time etc.
- Analyse the response time of database with the customizable dashboard and set thresholds accordingly to receive alerts and notifications.
With Motadata Oracle Database Monitoring Solution, you need not compromise on services relying on your database.
When you know what’s happening inside your database, you can effectively manage Oracle’s memory structures as well as processes.
It will help you achieve consistent customer experience as well as fine-tuned database servers.
The database monitoring solution facilitates extensive round-the-clock monitoring of your oracle databases and ensure that your Oracle database has enough buffer to perform & sort the operations within memory rather than performing on disk
To understand more on your oracle database blocking hierarchy, to know the actual workload and responsible factors behind a slowed database with root cause analysis, and to generate reports manually or schedule them based on 100s of Oracle database monitoring statistics collected and monitored in real-time, request a demo.
FAQs:
Oracle database monitoring involves tracking the performance, availability, and health of Oracle databases to ensure optimal operation and quick issue resolution.
Monitoring helps prevent downtime, improves performance, ensures data integrity, and enhances overall system reliability, which is critical for business operations.


