As any business expands, the network infrastructure also grows in size and complexity. As a result, IT enterprises require large-scale network devices and architectures to meet business requirements.
The virtual servers and remote devices allow the enterprise to design a hybrid infrastructure with limited physical components available at a prominent cost. Therefore, an organization needs to adopt a virtual network to meet such additional overheads.
Implementing virtual networks and machines provides IT enterprises a wide range of capabilities. From saving the overall cost, minimizing energy expenses, and streamlining disaster recovery to easing data center management, virtual network management provides a wholesome experience.
In addition, virtual networks enhance operation productivity and scale-up efficiency. However, it can be challenging to manage virtual network devices and architecture without proper virtual network management.
Unlike conventional network infrastructure, virtual networks and devices are crucial with performance, and they are required to get monitored around the clock. Motadata AIOps provides a comprehensive outlook on the enterprise’s network and visibility into virtual and on-prem networks.
Discover Virtual Devices
Motadata AIOps lets you individually identify the issue with every virtual machine and database. You can enter the profile credentials of your vCenter, ESXi or Xen, and it will auto-discover the VMware, Hyper-V, or Citrix Xen according to your virtual machines. It identifies every virtual machine and instance associated with the host and adds them to the inventory.
Once all the virtual instances are added to your inventory, the virtual network monitor automatically displays the relevant performance metrics of those devices with its by-default built-in templates.
It also provides visibility into your virtual network with every instance and host’s summary information. As a result, you can get real-time data about the availability and performance of the virtual instances in one place without shifting to multiple monitoring solutions.
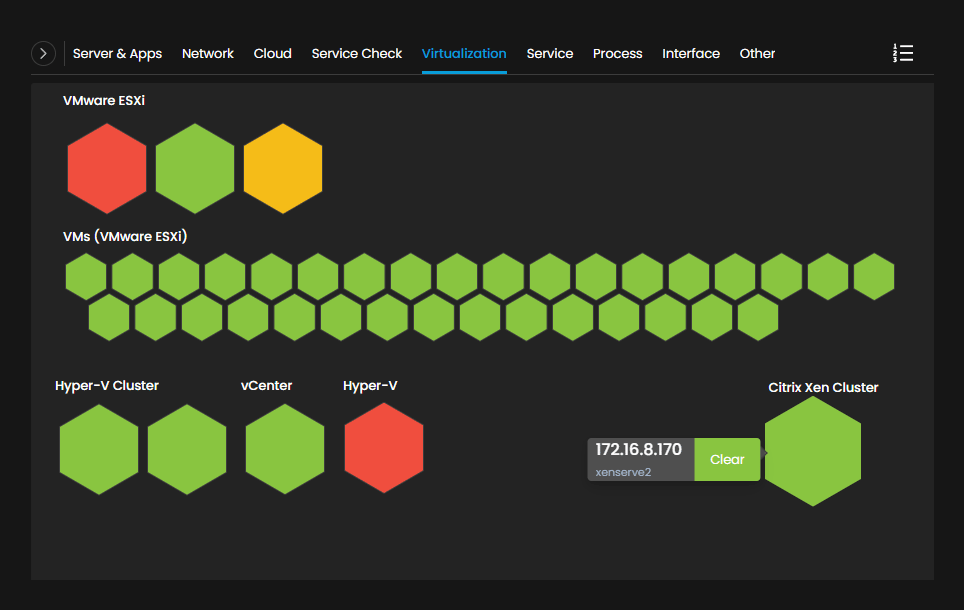
The heat map view provides the status about your virtual devices and their severity. The severity information makes it easy to perform the actions and confident decisions about the virtual machines.
This lets you keep your network perform efficiently and obtain healthy virtual operations.
Configure Alerts based on Thresholds
You can retrieve all the metrics data from the monitored virtual devices with APIs, and for extensive monitoring, you can use SNMP, WMI, or CLI protocols that can help you gather the data from the virtual machines.
Set thresholds for the performance monitors and get notified whenever there is any performance violation. The out-of-the-box monitoring templates help you meet your monitoring requirements.
The advanced alerts help you identify the issues with your virtual networks. You can configure all types of monitoring alerts with Motadata under a single console.
You can get notified for various scenarios, such as avoiding redundant examinations, addressing unattended alerts, maintenance alerts, etc. In addition, you can get notified via different ways such as emails, SMS, etc.
Topology Mapping & Capacity Planning
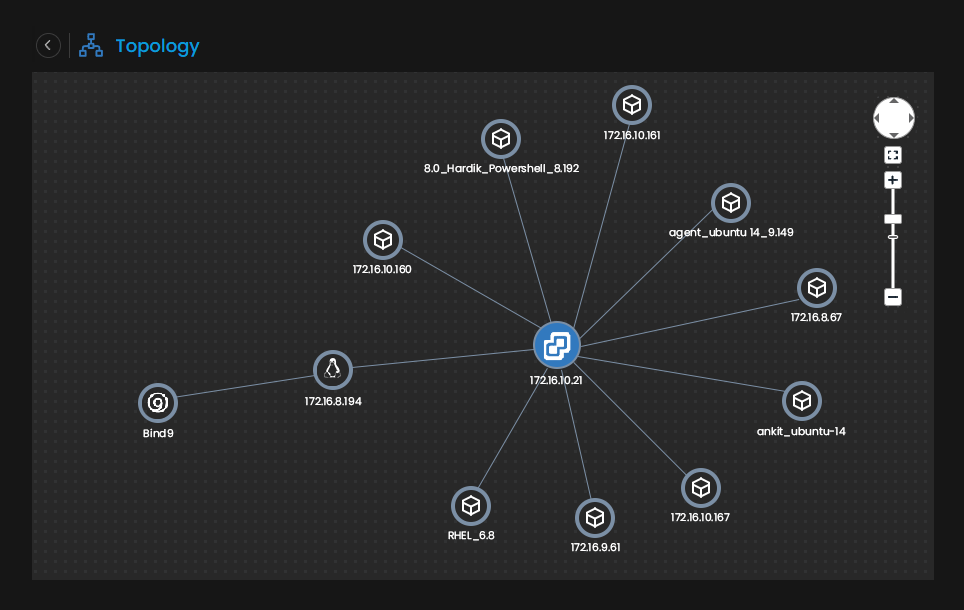
You can visualize your virtual network with topology mapping. It pictures the relationship between hosts and virtual instances. It also lets you track the migration of virtual machines across physical hosts.
In addition, the automated workflows help you perform your routine tasks effortlessly and troubleshoot issues easily. For example, you can automate tasks such as powering VMs on/off, refreshing the database, or even suspending certain VM operations of VMs whenever specific thresholds are violated.
As it helps you with the resource consumption levels of your virtual machines and hosts, it lets you perform capacity planning for future investments. You can track down the consumption levels of resources and discover the underutilized hosts.
The customized dashboards and virtual network-specified widgets help you with visibility across your virtual network.
In addition, you can also display the dedicated VM sprawl dashboards where you can monitor the resources consumed by virtual machines and hosts and get actionable insights.


