Imagine having total awareness of your apps: observing the effects of code on efficiency, identifying bottlenecks, and predicting crashes.
The open-source observability platform OpenTelemetry makes this possible.
OpenTelemetry, designed to collect telemetry data, provides you with the knowledge necessary to enhance your systems and provide a flawless user experience.
Its capacity to provide insight into software behavior and improve operational efficiency presents a significant advancement in observability and monitoring.
In this blog, we will explore different facets of OpenTelemetry and how it facilitates the process of enhancing modern observability.
What is OpenTelemetry, and How Does It Work?
OpenTelemetry is an open-source observability framework consisting of various tools, APIs, and SDKs. It enables IT teams to create, gather, and share telemetry data, such as performance metrics and logs, to evaluate software performance and behavioral patterns.
OpenTelemetry gathers telemetry data and exports it to a destination system. The ultimate goal of the project is to make data collection more system-agnostic than it is.
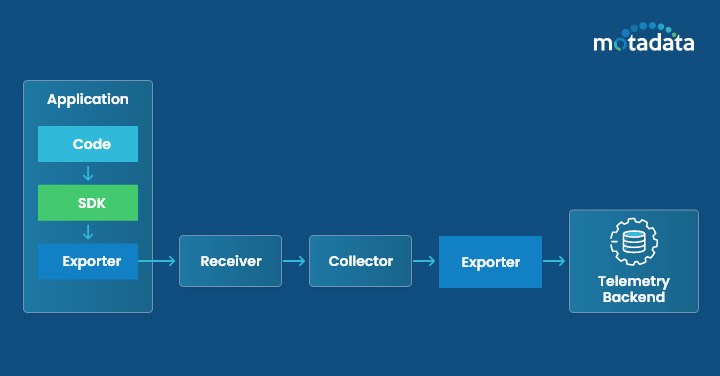
From beginning to end, there are several steps in the data lifecycle. It performs the following actions and offers specific information along the way:
- Gives system components instructions on what metrics to collect and how to collect them by using APIs to instrument code.
- Uses SDKs to combine the data and move it for processing and exporting.
- Uses multi-source contextualization to enrich the data after it has been broken down, sampled, and filtered.
- Changes the data and exports it.
- Carries out additional filtering in batches before sending the data to a predefined backend.
Why is OpenTelemetry Important?
OpenTelemetry is important in today’s IT environment for a number of reasons. Gathering, evaluating, and displaying crucial telemetry data significantly contributes to increasing observability and promoting overall system health.
Here are some areas where OpenTelemetry plays a vital role:
Observability: OpenTelemetry makes distributed tracing easier, which improves system monitoring and troubleshooting.
Through the collection, analysis, and comprehension of telemetry data across diverse system components, it also improves observability for enterprises.
Its efficient distributed tracing lowers latency and operating expenses while identifying system enhancements.
Integration: OpenTelemetry is a flexible option for a range of IT configurations since it integrates easily with a large number of well-known languages, frameworks, and applications.
Performance: OpenTelemetry is well-known for its quick performance and low overhead. This allows monitoring operations to go on without interruption, as it has no negative effects on a system’s regular functioning.
Industry-Standard Solution: OpenTelemetry is an industry-standard solution that facilitates quicker system migrations and smoother vendor interactions, both of which are very beneficial to IT Ops.
By using the generated insights for proactive incident management, OpenTelemetry offers dependable service observability.
What are the Components of OpenTelemetry?
OpenTelemetry components broadly consist of the following:
Collector
The collector offers a vendor-neutral proxy for telemetry data importing, processing, and exporting.
It provides collector Contrib packages that let you export data to several backends, often concurrently, and receive it in various formats, including OTLP, Prometheus, and Jaeger.
Language SDKs
Language SDKs utilize the OpenTelemetry API to generate telemetry data in a particular programming language and export it to a particular backend.
The OpenTelemetry SDKs serve as the basis for the automated instrumentation that is included with OpenTelemetry Contrib packages for popular libraries and frameworks.
Automatic Instrumentation
OpenTelemetry supports many components that produce telemetry data from popular frameworks and libraries for supported languages.
For example, an HTTP library generates data on the specific requests it receives and sends out.
While one language might pull a package from the codebase, another might need to have a component loaded alongside the program.
Languages also differ in how many widely used libraries and frameworks provide automatic instrumentation.
Exporter
Exporters allow telemetry to be uploaded to one or more desired backends within an application.
By separating the instrumentation from your backend configuration, an exporter facilitates backend changes without requiring changes to the instrumentation in the code.
The Benefits of OpenTelemetry
The implementation of OpenTelemetry offers the following benefits:
Data Collection Standardization
OpenTelemetry achieves increased visibility and streamlined observability through open standards and standardized data collection.
Teams can uncover performance problems, gain a better understanding of system health, and shorten the time it takes to address root causes.
The reduction of noise, expenses, and setup modifications enables enterprises to concentrate on utilizing their data instead of managing its collection.
Mitigating Vendor Lock-In
IT Ops can select any desired back end with OpenTelemetry since it releases them from vendor lock-in, future-proofing their investment.
They are never tied to a particular vendor because of their ability to handle changes to systems and processes. This lets businesses grow and adapt as their technological demands change.
Because of this freedom and adaptability, organizations can make business decisions based more on what’s best for their bottom line than on the constraints of technology.
A Need for Standardization: Enter OpenTelemetry
OpenTelemetry offers a standardized approach by providing unified APIs, libraries, and instrumentation standards for generating, collecting, and exporting telemetry data from cloud-native applications.
Regardless of vendor or technological stacks, OpenTelemetry follows industry-standard standards and protocols to enable smooth integration and data sharing across a range of monitoring systems.
Since it is an open-source project, a broad community of contributors may drive continual progress within the observability ecosystem through cooperation and innovation.
In addition, OpenTelemetry’s dedication to vendor neutrality guarantees fairness for both suppliers and consumers, encouraging openness, diversity, and compatibility.
By providing enterprises with a dependable and innovative approach to software stack instrumentation, OpenTelemetry enables them to maximize the value of their telemetry data while preserving their independence and adaptability.
OpenTelemetry vs. OpenTracing vs. OpenCensus
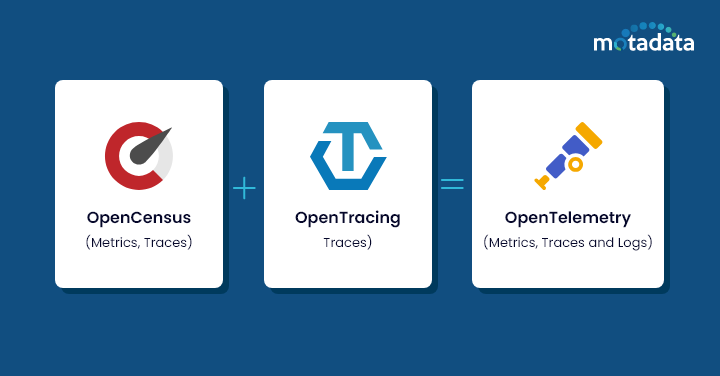
OpenTelemetry is the follow-up project to OpenTracing and OpenCensus.
The Cloud Native Computing Foundation (CNCF) provided support for both Google OpenCensus and OpenTracing, and the two initiatives formed OpenTelemetry 2019.
OpenTracing provides a vendor-neutral API for creating distributed tracing instrumentation and a set of semantic rules to ensure consistency in the telemetry generated.
OpenTracing was a collection of interfaces that other implementations could use to improve portability.
Although it is no longer developed, It was first released in 2016 and is still used by several tracer implementations and integrated into popular apps.
OpenCensus projects offer libraries for gathering distributed trace data and application metrics and transferring data in real-time to a backend.
Originally developed by Google, it was added to its internal census library before becoming an open-source tool in 2018. OpenCensus is not officially abandoned, and further security patches and maintenance are expected.
The merger’s goal was to give consumers a single, cohesive solution that eliminates the need to select between conflicting standards and streamlines observability instrumentation.
Users benefit from this unified approach by having access to a standardized collection of libraries and APIs that function together.
This removes the burden of managing various independent tools and allows users to obtain deeper insights into application behavior and performance.
OpenTelemetry Architecture Explained
Let’s take a look at the OpenTelemetry architecture and how its different moving parts operate:
APIs and SDKs: Developers can add instrumentation to their programs using standardized API interfaces, generating telemetry data like metrics, logs, and traces.
Programming languages like Java and Python have software development kits (SDKs) that offer pre-built libraries and tools to make the process of instrumenting applications easier.
The Collector: After gathering data from instrumented applications and services and processing it through aggregation and filtering, the collector sends the processed data to backend systems for analysis and archiving.
Users can send telemetry data to different destinations, such as logging systems and storage solutions.
Data Formats: OpenTelemetry standardizes data formats using the OpenTelemetry Protocol (OTLP), which specifies a standard format for encoding telemetry data to ensure consistency and interoperability among different observability stack components.
The Power of OpenTelemetry
The potential of OpenTelemetry can be seen through the following aspects:
Vendor Neutrality: Organizations can select the backends for their telemetry data without worrying about vendor lock-in, thanks to vendor neutrality.
Users can future-proof their observability stack by offering interoperability across different observability tools and platforms. This allows users to smoothly transition between providers as needed.
Standardization: Organizations can achieve improved consistency in their observability data and obtain comprehensive insights into the behavior and performance issues of their systems by implementing standardized instrumentation and data formats.
OpenTelemetry allows companies to react more quickly to changing market conditions and business requirements.
Community and Support: OpenTelemetry is supported by the Cloud Native Computing Foundation (CNCF) and a community of contributors, which encourages ongoing development and enhancement.
Frequent updates and new features ensure that OpenTelemetry continues to innovate and provide value to users.
Business Benefits of OpenTelemetry: OpenTelemetry provides observable advantages in terms of better Mean Time to Detect (MTTD) and Mean Time to Resolve (MTTR).
Organizations can minimize the impact on end users and business operations by proactively identifying and addressing issues using OpenTelemetry’s broad visibility.
OpenTelemetry in Use Cases
OpenTelemetry can be implemented for the following use cases:
Microservices Monitoring
OpenTelemetry allows organizations to obtain a thorough understanding of the behavior and performance of distributed systems made up of interconnected microservices.
Developers may track requests as they move through the system and discover bottlenecks, latency problems, and error circumstances to guarantee peak performance and dependability.
Kubernetes Observability
By offering instrumentation libraries and connectors with Kubernetes-native tools, an OpenTelemetry project makes monitoring and troubleshooting within Kubernetes clusters easier.
Operators can ensure the smooth running of containerized workloads by tracking application health, monitoring resource use, and diagnosing problems within Kubernetes settings.
Performance Optimization
Businesses can find performance bottlenecks, maximize resource use, and improve system efficiency by gathering and evaluating telemetry data from applications and infrastructure components.
Monitoring and profiling made possible by OpenTelemetry empowers developers to identify problem areas and iteratively update their code and setups to provide the best possible user experiences.
Incident Response
With OpenTelemetry’s real-time visibility into system health and performance, teams can identify anomalies and possible failures before they affect consumers. When an event happens,
OpenTelemetry helps teams quickly discover the cause and deal with it by correlating telemetry data across layers of the stack.
OpenTelemetry promotes an anticipatory approach to issue response.
Getting Started with OpenTelemetry
In order to begin implementing OpenTelemetry within their frameworks, developers can follow these steps:
Choosing a Language or Framework
Choose the SDK that is compatible with your programming language or framework. OpenTelemetry offers SDKs for many languages, such as Java, Python, JavaScript, and others.
These SDKs make instrumentation for telemetry data collection within your apps easier by including pre-built libraries and tools.
Basic Instrumentation
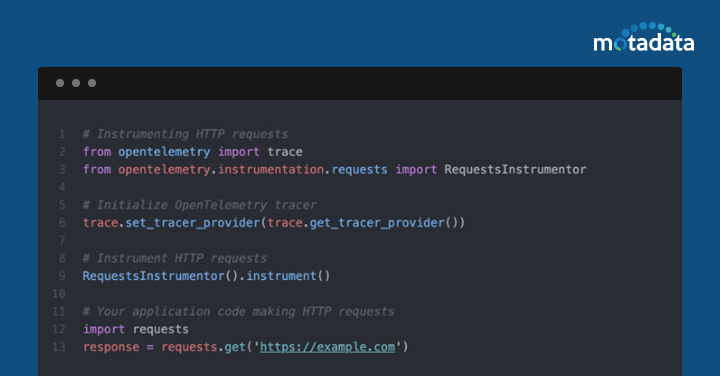
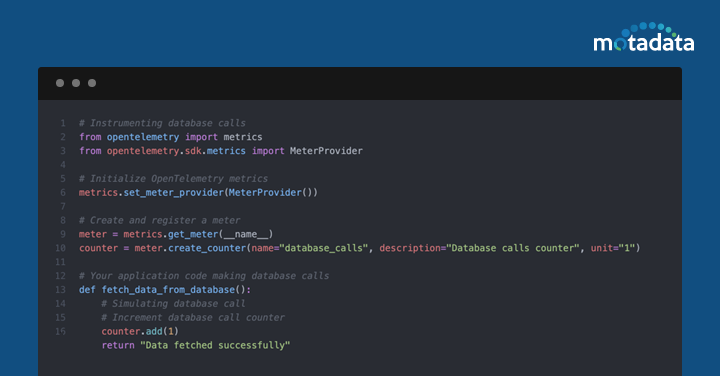
Adding a few lines of code to your application will enable OpenTelemetry to instrument it and begin producing telemetry data.
For example, you can use middleware or interceptors to record headers, status codes, and request durations while instrumenting HTTP requests in Python.
Metrics such as query execution time and database response codes can be recorded through the instrumentation of database calls.
Here are some code samples that use the OpenTelemetry SDK to demonstrate basic Python instrumentation:
Configuring an Example Backend
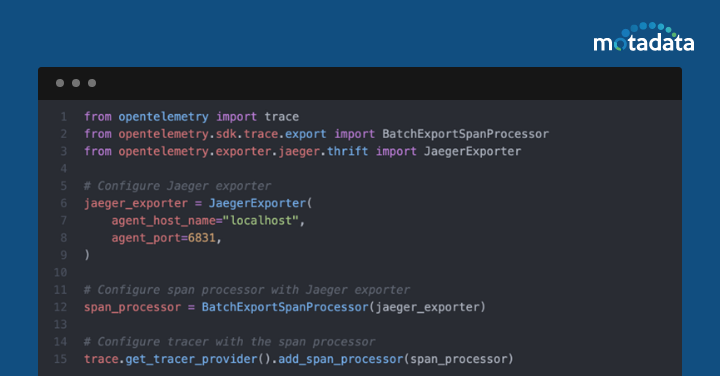
You can set up your instrumented application to send telemetry data to a backend for processing and display. Jaeger is a widely used open-source distributed tracing tool for this purpose.
To configure your application to send telemetry data to Jaeger, you need to set up a Jaeger exporter and configure it with the appropriate endpoint. Consider the example block of code below:
Once this setup is complete, your application will start providing telemetry data to Jaeger for analysis and visualization.
With this simple setup, you can start using OpenTelemetry right away.
OpenTelemetry: Considerations and Challenges
As with any technology and framework, there are some things developers need to consider before choosing to use OpenTelemetry:
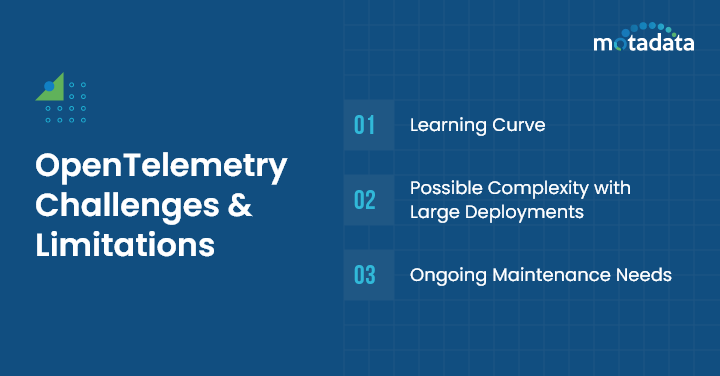
Challenges and Limitations
Learning Curve: Adopting OpenTelemetry comes with a learning curve, which can be a major obstacle.
It is important to be familiar with the OpenTelemetry SDKs, APIs, and best practices in order to implement telemetry instrumentation and configure data collection.
Teams switching from traditional monitoring methods may find this challenging.
Possible Complexity with Large Deployments: Throughout the whole infrastructure, instrumentation and telemetry data collection might be difficult to manage in large-scale deployments of various services and components.
Managing the amount of telemetry data generated while maintaining efficient instrumentation can prove to be difficult in practice.
Ongoing Maintenance Needs: It takes constant work and resources to maintain OpenTelemetry instrumentation and to make sure it works with changing application architectures and observability requirements.
Strategies to Overcome Challenges
Documentation and Resources: OpenTelemetry provides an array of tools to help users overcome obstacles.
Documentation, tutorials, and example applications can provide help on how to begin with instrumentation and address typical use cases.
Online communities and forums provide users with a place to ask for help and work together with people dealing with similar issues.
Best Practices: Telemetry adoption issues can be minimized by adhering to the recommended methods for instrumentation, setup, and deployment. Standardized instrumentation procedures, uniform naming guidelines, and the use of auto-instrumentation can simplify deployment and cut down on complexity.
Community Support: The OpenTelemetry community helps users resolve issues by providing insights and support through participation in community events, making contributions to open-source projects, and consulting with professionals.
Community-driven projects like hackathons and webinars encourage the sharing of knowledge resources, allowing participants to effectively overcome obstacles.
Conclusion
OpenTelemetry’s easy connection with tools like Prometheus and Jaeger improves analysis and visualization capabilities and helps enterprises understand system behavior and performance better.
Users can analyze and visualize system behavior by using OpenTelemetry to easily connect traces, metrics, and logs obtained by Jaeger, Prometheus, and other tools.
Motadata is a problem-solving platform and innovator in the IT space, allowing users to reduce downtime with real-time alerting and machine learning-powered analytics for logs, metrics, and traces.
OpenTelemetry’s integration with Motadata’s data collection provides organizations with a comprehensive setup of modern observability.
Explore more resources and consider OpenTelemetry for your next project!
FAQs
OpenTelemetry collects various types of telemetry data, such as traces, metrics, and logs. Log data records events and messages for analysis and troubleshooting; metrics record quantitative evaluations of system performance; and traces offer a picture of how requests move across a distributed system.
Users of OpenTelemetry can set up data transmission and collection according to their needs. It offers choices for access control, authentication, and encryption to guarantee the privacy and accuracy of telemetry data.
OpenTelemetry offers a standardized method for observability, which encourages cooperation and openness among DevOps teams. It makes it possible for developers to efficiently communicate and work together to solve problems, maximize performance, and promote ongoing process improvement.


