In the fast-paced world of equity broking, compliance with regulatory requirements and operational efficiency are paramount.
Broking platforms must ensure that their systems are not only continuously monitored, but their data is accurately reported to regulatory bodies.
This is a story of how a leading equity broker from India leveraged our AIOps APIs to meet their regulatory compliance requirements while achieving operational excellence.
Client Background and their Challenges
Our client, a reliable equity broking platform in India, is required to send regulatory bodies the monitoring data of its servers.
The company faces strict compliance requirements, and any failure to comply with these obligations can result in penalties and affect the brand’s reputation.
The manual processes for sending the required data could be cumbersome and prone to errors, posing a significant risk to compliance, finances, and operational efficiency.
The client needed a reliable and automated way to collect, monitor, and transmit server monitoring data to regulatory bodies, which can be daunting without the right tools.
The Solution: Enter Motadata AIOps
Our AIOps Solution has cutting-edge monitoring abilities and robust APIs.
The AIOps solutions offer a suite of APIs that enable users to automate the collection, analysis, and submission of server monitoring data.
By integrating these APIs, the client could automate their compliance reporting effortlessly.
Here’s how they did it:
Authentication: To securely access these APIs, the client authenticates their requests using an API key provided by AIOps. This step ensured that all data exchanges were secure and authorized.
Retrieve Detailed Information About All Monitors:
- API Endpoint: /API/monitors
- Sample Output:
{

"result": [

{

"id": 48159328544,

"object.target": "172.16.8.2",

"object.ip": "172.16.8.2",

"object.host": "cisco_core.motadata.local",

"object.name": "cisco_core.motadata.local",

"object.system.oid": ".1.3.6.1.4.1.9.1.2494",

"object.type": "Switch",

"object.discovery.method": "REMOTE",

"object.state": "ENABLE",

"object.category": "Network",

"remote.address": "127.0.0.1",

"user.name": "admin",

"object.creation.time": "2024/07/11 15:21:18",

"object.creation.time.seconds": 1720691478,

"object.business.hour.profile": 10000000000001,

"object.id": 10,

"object.groups": [

10000000000002

],

"object.snmp.device.catalog": 10000000011869,

"object.make.model": "Cisco Catalyst 93xx Switch Stack",

"object.context": {

"ping.check.status": "yes",

"port": 161,

"snmp.check.retries": 2,

"interface.discovery": "yes",

"topology.plugin.discovery": "yes"

},

"object.vendor": "Cisco Systems"

}

]

}
- Usage: This API fetched comprehensive details about all the servers being monitored.
- Outcome: The client could now access detailed information about all their servers, ensuring no critical data was missed.
Retrieve Monitor Status Using Monitor ID:
- API Endpoint: /api/monitors/{monitorId}/status
- Sample Output:
{

"result": {

"status": "up"

}

}
- Usage: This API allows the client to retrieve the current status of each server, ensuring that only up-to-date information is sent to the exchanges.
- Outcome: Real-time status updates allowed the client to monitor server health continuously.
Retrieve the Last Poll Information for a Monitor:
- API Endpoint: /api/monitors/{monitorId}/last-poll
- Sample Output:
{

"result": {

"Availability": 1722858880,

"Network Interface": 1722859000,

"Routing Protocol": 1722858880

}

}
- Usage: This API provided the last poll information, including the time and results of the previous server check, which was crucial for compliance reporting.
- Outcome: Accurate and up-to-date poll information ensured compliance reports were always current.
Outcome
With these APIs, the client successfully automated their obligations to their regulatory bodies by sending them timely and accurate data.
This not only enhanced their compliance efficiency but also freed up valuable resources for other critical tasks.
The client’s journey from manual data processing and transmitting to automated efficiency was a noteworthy success.
A New Challenge
Let’s explore another use case involving a client who provides EMS (Enterprise Management Services) to its customers.
Due to contractual obligations, our client, the EMS service provider, must ensure that the availability of its servers does not fall below a certain threshold, ensuring uptime for its customers opting for the EMS services.
The Solution
To meet these obligations, our client implemented the following steps using the APIs:
Dashboard Creation:
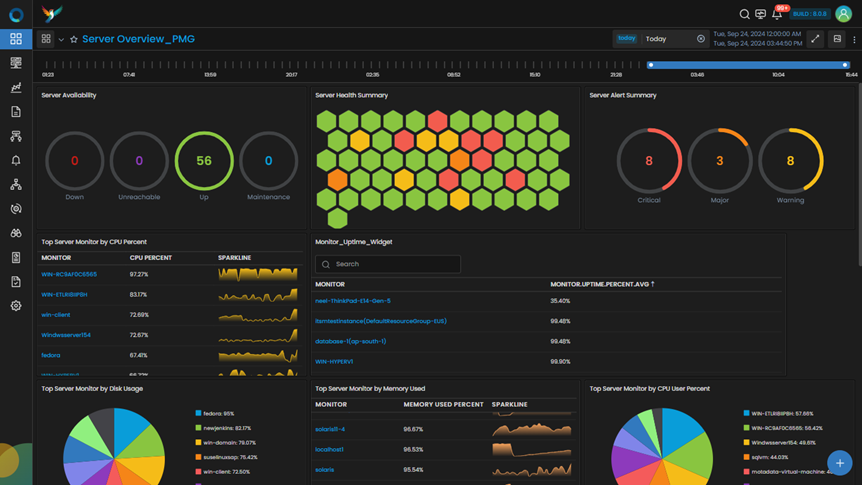
They created a comprehensive dashboard with widgets displaying the availability data of their servers.
This dashboard allowed them to monitor their critical servers in real-time.
It also enabled them to use AIOps APIs to efficiently send this data to their clients, maintaining their required contractual obligations of ensuring server uptime.
As you can see in the image of a sample dashboard below, the widget ‘Monitor_Uptime_Widget’ shows the data of a monitor’s uptime percentage.
The client created similar widgets for their use.
Retrieve all performance metrics dashboards:
- API Endpoint: API/v1/visualization/dashboards
- Sample Output:
{

"response-code": 200,

"status": "succeed",

"result": [

{

"Network": [

{

"dashboard.name": "Up devices dashboard",

"dashboard.category": "Network",

"dashboard.access.type": "public",

"dashboard.users": [

1222223

],

"dashboard.context": {

"dashboard.widgets": [

{

"id": 51001190939,

"x": 0,

"y": 0,

"h": 7,

"w": 10

}

]

},

"id": 51001190938

}

],

"Server": [

{

"dashboard.name": "Up devices dashboard",

"dashboard.category": "Network",

"dashboard.access.type": "public",

"dashboard.users": [

1222223

],

"dashboard.context": {

"dashboard.widgets": [

{

"id": 51001190939,

"x": 0,

"y": 0,

"h": 7,

"w": 10

}

]

},

"id": 51001190938

}

]

}

]

}
- Usage: This API fetched details about all the dashboards with performance metrics in AIOps.
- Outcome: The client could now access the information about all the dashboards they created.
Retrieve Widgets from a Specific Dashboard:
- API Endpoint: API/v1/visualization/dashboards/:id
- Sample Output:
{

"response-code": 200,

"status": "succeed",

"result": [

{

"dashboard.name": "Up devices dashboard",

"dashboard.category": "Network",

"dashboard.access.type": "public",

"dashboard.users": [

1222223

],

"dashboard.context": {

"dashboard.widgets": [

{

"id": 51001190939,

"x": 0,

"y": 0,

"h": 7,

"w": 10

}

]

},

"id": 51001190938

}

]

}
- Usage: This API fetched all the widgets from a particular dashboard.
- Outcome: This enabled them to identify all the widgets that contained performance metrics.
Retrieve details of a specific widget, like widget name by its ID:
- API Endpoint: API/v1/visualization/widgets/:id
- Sample Output:
{

"response-code": 200,

"status": "succeed",

"result": [

{

"visualization": {

"name": "Top resources",

"description": "Top resource by MongoDB Request",

"category": "TopN",

"type": "Area",

"Visualization.timeline": {

"relative.timeline": "today"

},

"properties": {

"chart": [

{

"legend": "yes",

"label": "no"

}

]

}

},

"id": 51001190938

}

]

}
- Usage: This API fetched the widget names using the widget ID they identified in the previous step.
- Outcome: This enabled them to identify the widget containing the specific performance metrics they are looking for so they can search for them in the next step.
Retrieve Performance Metrics Information Based on Widget ID:
- API Endpoint: API/v1/query/visualization/:id
- Sample Output:
{

"response-code": 200,

"status": "succeed",

"result": [

{

"monitor": "cisco_core.motadata.local",

"system.cpu.percent^max": 79

}

]

}
- Usage: This API was used to fetch the server availability and uptime performance metrics using the widget ID identified in the previous steps.
- Outcome: This enabled them to retrieve all the performance metrics of their server availability and use them further.
Outcome
By following these steps, our client was able to provide proof of maintaining the required amount of uptime, thereby fulfilling their contractual obligations and avoiding any customer penalties.
Conclusion
Ensuring compliance and operational efficiency is vital for enterprises today.
Our clients, whether equity brokers or EMS providers have successfully leveraged our AIOps APIs to automate their monitoring and reporting processes.
This automation not only ensures compliance with regulatory bodies but also enhances operational efficiency by freeing up valuable resources.
Our clients have been able to meet their contractual obligations, avoid penalties, and maintain high standards of service uptime.
These success stories highlight the transformative power of AIOps .
Are you facing similar challenges in your organization? Do you need to ensure compliance and operational efficiency while managing your IT infrastructure?
Discover how our AIOps solutions can help you automate your monitoring and reporting processes, ensuring you meet your regulatory and contractual obligations effortlessly.
Contact us today to learn more about Motadata AIOps and how it can transform your business operations.
Let us help you achieve operational excellence, compliance, and a lot more with ease.


