In modern IT systems, most businesses adopt new tools and technologies to stay ahead of competitors. These new technologies are resulting in the proliferation of distributed IT systems.
For instance, some enterprises implement cloud computing, edge computing, or microservices architecture, contributing to complex distributed systems across organizations.
With the rise of such complex and dynamic distributed systems, one must adopt a better strategy for smooth operations.
Traditional monitoring practices are not enough to handle these complexities. This is why robust observability is essential, as it helps better measure internal processes and troubleshoot issues in real-time.
However, successfully implementing observability is no easy task. Several businesses’ common errors can reduce the return on their observability efforts.
Let us explore some common observability missteps and pitfalls that most businesses make. We have also listed some of the best practices for effective observability.
Understanding Observability in Modern IT Environments
Observability is a critical concept that provides better visibility into internal processes and resolves complex computing problems in a business using data collected from logs, metrics, and traces.
The collected data is further used to analyze and generate insights to measure performance and identify errors that may impact users.
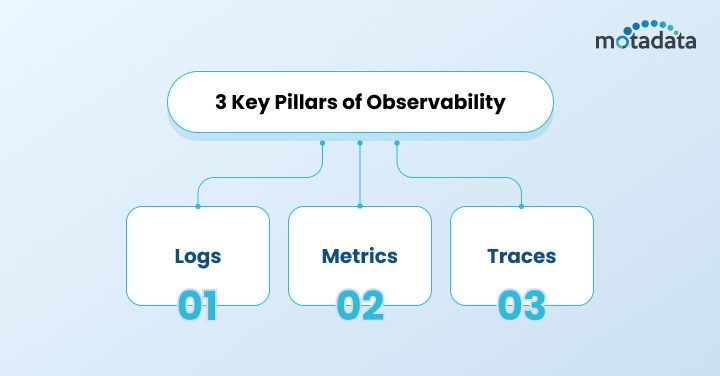
The 3 Key Pillars of Observability include:
Logs: Logs are the text records of all events and user interactions within an organization. Using these insights, issue diagnosis becomes easier.
Metrics: Quantifies different features of system performance, such as response time, memory usage, CPU usage, etc., that help measure overall health and performance. Using these insights, tracking changes and patterns becomes easier.
Traces: Traces provide insights into how each service connects and responds. Businesses can quickly identify latencies, delays, and bottlenecks in the systems using this data.
Remember that having access to all three essential pillars is not enough to achieve actual environment observability.
The only way to genuinely say that observability has served its purpose is when you can use the telemetry data to enhance end-user experience and accomplish your business goals.
With the advancement of technology, businesses are adopting various practices and incorporating applications, creating a highly distributed system. Identifying errors in such complex systems is challenging with basic monitoring systems.
This is why implementing observability practices matters, as it will provide clear visibility and insights and identify bottlenecks in the system.
Data analysis can help team members better understand what went wrong and when in highly distributed systems.
If performance is affected by a network failure, slow speed, or a broken connection, data analysis can assist in determining the underlying cause.
By using observability technologies to adapt alerts about issues, teams can proactively address them before they impact users.
Further, using observability practices, businesses gain a holistic view of system health and trace the root cause of performance issues.
Effective observability further helps optimize resource allocation, reduce mean time to resolution (MTTR), and deliver a better user experience.
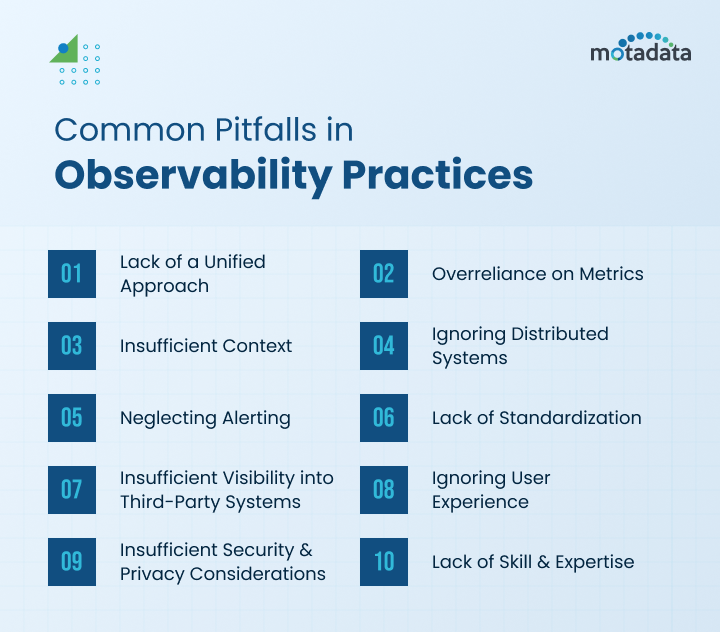
Common Pitfalls in Observability Practices
The process of incorporating observability solutions is not simple. Many organizations make typical mistakes that make obtaining insightful information difficult and efficiently addressing problems.
Let’s look at some of the common mistakes that professionals make in observability.
1. Lack of a Unified Approach
- Multiple Tools, Multiple Problems: Let’s say each team member uses different tools to track the overall performance or health of the system. In such a case, miscommunication or mismanagement is common, especially if the tools don’t integrate well. As a result, the “data silos” created by this fragmentation can make it more challenging to perform root cause analysis.
- Data Overload: Observability tools may collect large volumes of data for monitoring and analysis. But what if most of this information is irrelevant? This may become a problem if there are no clear objectives. There is a high chance that meaningful insights might be missed, making it more difficult for teams to determine the underlying cause of problems or critical issues swiftly.
- Inefficient Alerting: Poorly configured alerts or excessive alerting is another observability pitfall. If the alert systems are not correctly configured, the teams may receive false or unnecessary notifications, resulting in operational delays or poor performance. Team members may also ignore critical alerts because of the excessive volume, leading to “alert fatigue.”
2. Overreliance on Metrics
- Limited Context: Metrics generally provide a clear picture of trends, patterns, and system behavior over time but sometimes lack the underlying context essential to resolve complex issues. Metrics without logs and traces might not fully help troubleshoot problems. For example, you might notice a sudden spike in the response time. However, you cannot come to a solution without a list of events and details related to how they happened. Hence, additional information from logs and traces is essential for effective troubleshooting.
- Missing the Big Picture: When teams only focus on metrics, they may miss important details about the system’s overall health. For instance, a CPU and memory metrics-focused observability configuration may show good utilization trends but overlook application-specific problems like a slow transaction rate. In short, focusing solely on metrics can hamper system performance.
3. Insufficient Context
- Lack of Traceability: Traces in distributed systems help understand how the issue happened. System requests pass through various services, and tracking them can be challenging with basic monitoring practices. Without effective tracing, you may lack clarity into dependencies between services and find it difficult to understand where or how errors occurred in the first place.
- Missing Log Data: Logs are text records of all events within a system. Incomplete or missing log files can make it extremely difficult for IT teams to troubleshoot issues or understand the real cause behind errors or warnings. Teams will gain incomplete visibility into system data, thus demanding more time and effort to identify and resolve the issue.
4. Ignoring Distributed Systems
- Challenges in Correlation: Observability tools collect data from multiple tools in different formats and time zones. Traditional practices can make correlating this data to identify the underlying cause of the problem challenging. For instance, if a database service fails, it may affect other services in an application. This may cause delays or errors in components that rely on it for further processes. Teams may also struggle to identify the problem without efficient correlation, resulting in delayed diagnosis and solution.
- Complex Dependency Mapping: In modern distributed systems, it is pretty challenging for team members to trace how each component or service interacts and impacts others’ performance. Without dependency mapping, issue identification and resolution are another struggle. The lack of visibility may lead to a longer mean time to resolution (MTTR) since teams must manually map relationships during incident response instead of depending on a developed dependency map.
Read Also: Achieving Faster Mean Time to Resolution MTTR with AIOps
5. Neglecting Alerting
- Poorly Configured Alerts: The central role of configuring alert systems is to get updated about critical events and system anomalies timely. Thus helping troubleshoot issues faster and improving response time. But, if the alerts are poorly configured, businesses may miss out on critical incidents, resulting in delayed response time and lousy end-user experience. Further, poor alert configuration may trigger unnecessary alerts that teams may start to ignore as they are irrelevant and miss the critical ones.
- Lack of Context in Alerts: If an alert lacks adequate context or details for immediate action, it is like a vague warning. It can even mislead the team members and push them to spend needless effort figuring out the problem’s underlying cause. It may also confuse team members and result in operational delays.
6. Lack of Standardization
- Inconsistent Data Formats: If your organization has multiple teams that manage the collected observability data, there is a high chance that inconsistencies in data formats may arise. Multiple teams mean the use of different structures, naming conventions, or data types that may lead to challenges in correlating data. Further, it may cause issues in identifying trends and data alignment. Without standardized formats, it can become challenging for businesses to get a clear view of their entire system’s health.
- Lack of Common Terminology: Each team member has a different way of communicating and acknowledging terms for the same process, which can lead to misunderstandings or potential errors. One team’s interpretation of a metric or event may be different from another’s due to a lack of common terminology, making it difficult to coordinate and address issues faster.
7. Insufficient Visibility into Third-Party Systems
- Limited Insights: An organization may not have comprehensive insights into the performance of third-party systems as it does not have any direct control over them. This lack of visibility may make it challenging to track third-party SLAs, issues, and their impact on performance.
- Delayed Incident Response: The failure or degradation of a third-party service can have a cascade effect on your system, but because of inadequate monitoring, these instances frequently go unnoticed.
8. Ignoring User Experience
- Lack of End-User Perspective: Engineers often focus on diagnosing technical metrics, such as database performance, error rates, etc., and miss on user experience. Page load time and response time are a few user-specific data that often go unreported, even when the system is technically operating smoothly.
- Delayed Response to Performance Degradation: If the observability tools do not track user-facing metrics, it can frustrate users. It can impact the performance as users respond to errors and queries based on the issues they are facing with your application. Response time delays can frustrate them and enable you to ignore the problem, resulting in performance degradation.
9. Insufficient Security and Privacy Considerations
- Exposure of Sensitive Data: The three key pillars of Observability tools often collect large amounts of information from multiple systems. This information may also include personally identifiable information (PII), API keys, or sensitive user data that must be secured. If any of this data gets exposed, it may erode trust and business goodwill. Hence, it is essential to avoid investing in improperly configured monitoring tools.
- Security Risks: Improper configuration can result in insecure APIs, Exposed Observability Dashboards, Misconfigurations, and other security risks. In fact, attackers may be able to gain unauthorized access if observability systems are not properly managed and best practices are not implemented.
10. Lack of Skill and Expertise
- Insufficient Training: Observability tools come with various advanced features and functionalities. Without proper training, teams may find it challenging to use the tool or miss out on the critical insights collected from the excessive data. Teams with less knowledge or expertise may struggle to troubleshoot issues or optimize system performance.
- Difficulty in Hiring Talent: Observability engineers must have proper knowledge and skills in data analysis or tool configuration for better management analysis of distributed architectures. Due to this shortage, hiring observability specialists may be challenging, particularly as more businesses use distributed architectures and want skilled personnel to oversee intricate systems. Due to a lack of talent, current team members are frequently under pressure to take on observability tasks without the necessary skills, which can affect system performance. Using resume templates can help streamline the process by guiding candidates to showcase their relevant skills and experience.
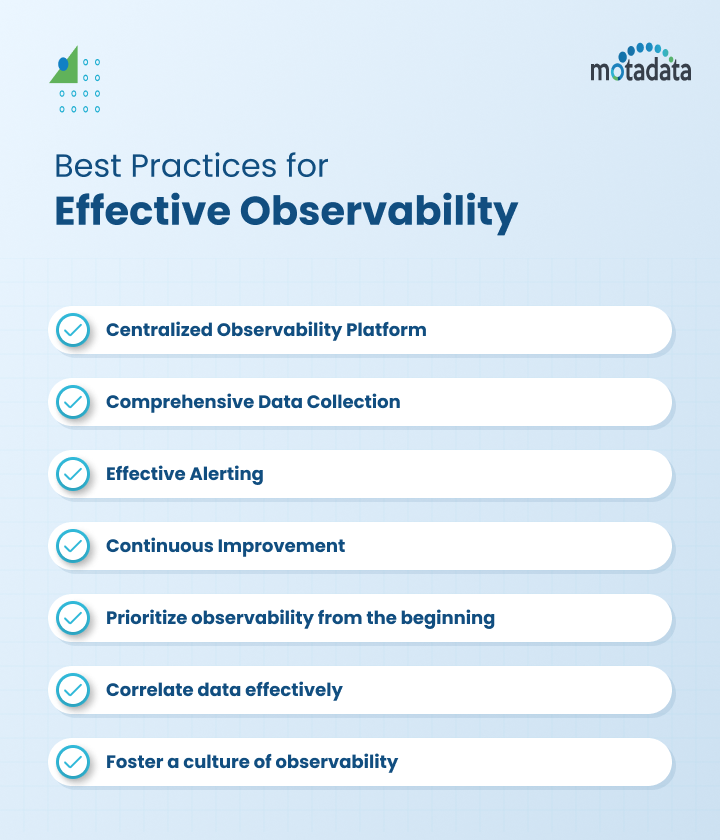
Best Practices for Effective Observability
To overcome the pitfalls of observability practices, organizations must implement or integrate these best practices effectively across teams for smooth operations and better performance.
1. Centralized Observability Platform:
Investing in a unified observability platform that collects data from multiple sources, analyzes it, and helps visualize data flow to improve monitoring and performance is essential.
2. Comprehensive Data Collection:
Unlike traditional practices, it collects data from all essential sources, metrics, logs, and traces to better understand internal processes and system health. This information, in turn, helps analyze system behavior and diagnose issues.
3. Effective Alerting:
Ensure your alert system is configured correctly and provides essential notifications in real-time. Adjust your settings and prioritize critical issues so you do not waste your time or energy on less important tasks.
4. Continuous Improvement:
Ensure your team members regularly review the data collected and refine observability practices according to the new changes.
5. Prioritize observability from the beginning:
Traditional practices are no longer enough to manage complex, distributed systems. Implementing observability practices from the beginning makes the entire issue detection, diagnosis, and troubleshooting process more straightforward.
6. Correlate data effectively:
This practice helps team members gain more clarity about the different components and their dependencies, further aiding in faster issue identification and resolution.
7. Foster a culture of observability:
Educate and guide engineering teams on data interpretation, tools, and best practices for observability. Please ensure team members know the significance and worth of observability in their day-to-day work.
Case Studies: Observability Failures
TSB, the UK’s Top-notch retail bank, introduced a modern banking platform to gain a large audience and expand digitally.
However, the company faced various challenges in transitioning to adopting multi-cloud architecture. It became difficult for TSB to gain visibility into the distributed components and analyze issues faster.
This not only made things difficult but also impacted customer experience and efficiency.
So, to resolve this issue, TSB incorporated the observability solution to better manage distributed components and dependencies.
This practice further enabled engineers to identify the underlying cause of the problem and address it before it affected performance or user experience.
Conclusion
Managing distributed systems and architecture using traditional monitoring practices in today’s complex IT environment is impossible.
Businesses need to incorporate observability practices for better outcomes, but they often make inevitable common mistakes. You cannot receive quality results if observability is done wrong.
For instance, if you have insufficient context, missing the bigger picture or only paying attention to metrics, lack standardization, correlation challenges, etc. These common observability pitfalls can compromise the effectiveness of your observability practice.
Hence, adopting some of the above-listed best practices is essential to enhance user experience and overall system performance.
Start assessing your company’s observability procedures right now and ensure you’re avoiding these typical mistakes.
Even if you manage to achieve your goals, there are a few mistakes that most team members unknowingly make that later cause trouble.
Remember, making the correct investment today can result in significant time, effort, and cost savings later on.
You can monitor the operations of all your systems, apps, and internal procedures with the help of observability tools.
To break down data silos, identify anomalous key events, and monitor your network in any setting, you can even invest in the Motadata Observability solution.


