What is AI-Powered Observability? A Complete Guide for IT Teams in 2026
Is your monitoring stack really giving you clarity, or just more alerts?
Your monitoring stack is probably working exactly as designed. That is the problem.
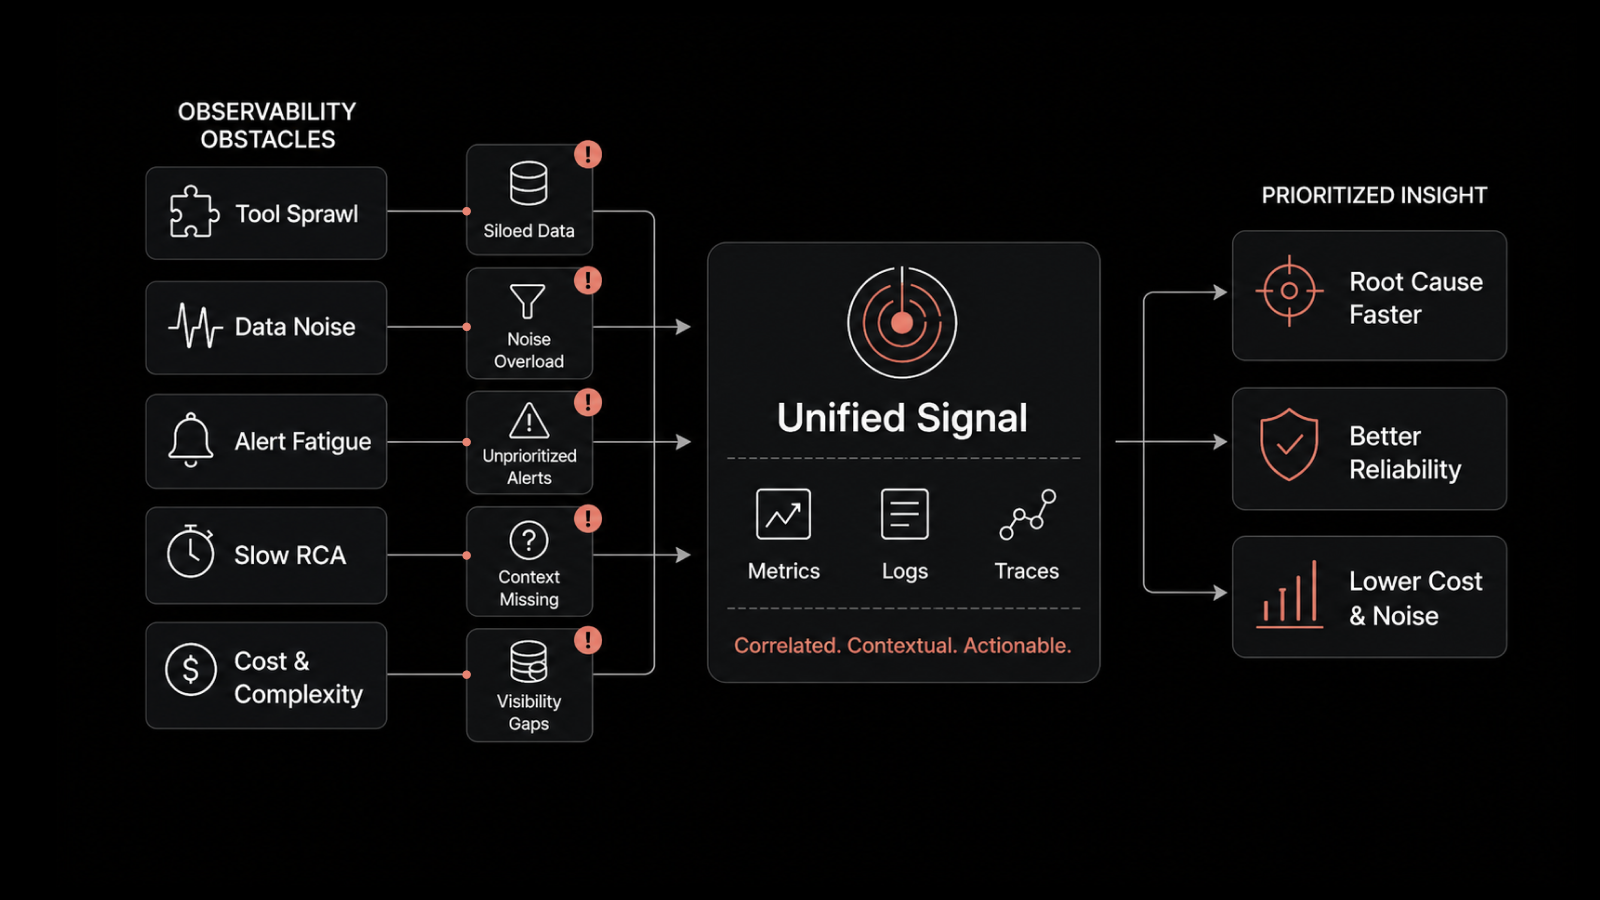
As systems grow, most IT and platform teams start to see the same patterns:
Alerts become too frequent and harder to trust.
One issue triggers multiple alerts across different tools, with no clear root cause.
Problems are often discovered by users before monitoring tools flag them.
Logs, metrics, and traces are spread across different systems, making debugging slow.
At this point, traditional monitoring starts to feel limited.
This is where teams begin exploring AI in observability.
In this guide, we will explain what AI-powered observability actually means, how it works, and when it is useful. You will also learn how to distinguish real AI-driven observability from tools that simply rebrand traditional monitoring with AI features.
What is AI-Powered Observability?
AI-powered observability means putting AI to work inside your monitoring tool so it does the analysis you do not have time to do by hand.
Normally, you set the rules and watch the dashboards yourself. Here, the platform takes that load off you:
It learns what normal looks like for each part of your system.
It tells you about real problems and stays quiet about harmless noise.
It bundles related alerts into one incident instead of many.
It warns you about trouble before it becomes downtime.
It points to the likely cause, so you are not left guessing.
The good news is it runs on data you already collect. In plain terms, that data is:
Metrics: numbers like CPU use, memory, and speed.
Logs: text records of what happened and when.
Traces: the path one request takes as it moves through your services.
Flows: how traffic moves across your network.
On its own, that is just a pile of raw data. Observability is what turns it into a clear answer about not only what broke, but why it broke.
The AI steps in when there is too much data to read. A mid-sized setup can throw off millions of data points an hour, and nobody can scan that by hand.
Machine learning can. It spots the slow drift that never trips a fixed alarm but still leads to an outage a few hours later.
One quick thing to clear up, because search results muddle it.
AI-powered observability means AI watching your IT stack.
That is different from AI observability, which usually means watching your own AI models and agents.
We sort out that difference in a section below.
New to the topic? Start with our explainer on what observability is before AI enters the picture.
How AI-Powered Observability Differs From Traditional Monitoring
Traditional monitoring asks you to know the answers in advance.
You set a threshold (alert me if CPU goes above 90 percent), and the tool pings you when the line gets crossed. In a small, predictable system, that is plenty.
In a big one, it breaks down. Here is why:
You cannot set a smart threshold for everything. With thousands of signals, each behaving differently at 3 a.m. than at 3 p.m., one fixed line is always wrong somewhere.
A fixed line misses the slow failures. It catches a dramatic spike but sails right past a gradual memory leak that quietly degrades for a week.
One problem becomes forty alerts. When a single root issue causes many downstream symptoms, threshold tools fire on all of them and leave you to untangle which came first.
AI-powered observability flips the whole approach:
Instead of you defining normal, the platform learns it from the data, signal by signal, and adjusts as things change.
Instead of treating every alert as its own event, it correlates them into one incident.
Instead of only reacting, it forecasts.
The result is fewer, smarter alerts and faster answers. One 200-person manufacturer we work with cut its mean time to resolution from about six hours to under three after moving correlation and routing into one place.
The tool did not outsmart the engineers. It just stopped making them do the sorting by hand.
The honest limit: this does not replace good instrumentation.
If you are not collecting the right data in the first place, no amount of machine learning will invent it for you.
What are the Five Things AI Does Inside an Observability Platform?
When a vendor says AI-powered, this is the short list of what that should mean. If a platform does not do most of these, the AI label is mostly marketing.
1. Anomaly Detection Without Fixed Thresholds
This is the foundation. The platform learns the normal pattern for each metric and alerts when something drifts off it, even when no number you would have picked gets crossed.
Why it matters: it catches the quiet problems. A slow rise in resource use that never trips a fixed alarm is exactly what turns into an outage during your next busy hour.
What it does: builds a moving baseline per signal instead of one global rule.
What it catches: an odd jump in consumption that could mean a scaling issue or a security event, even below your usual limits.
Bonus: it watches user-facing signals and spots a drop in experience before customers complain.
For the core idea, see our anomaly detection glossary entry.
2. Alert Correlation and Noise Reduction
A single issue rarely sends a single alert. A database bottleneck during a traffic surge can light up CPU, memory, and error-rate alerts across several services at once. Apart, each looks like its own fire. Together, they are one problem wearing forty costumes.
Why it matters: alert fatigue is real. When everything pages, nothing pages, and the alert that matters gets muted with the rest.
What it does: groups related alerts into one incident based on timing, shared components, or similar errors.
What you see: one issue, not forty notifications.
What it quiets: the known, recurring, low-priority alerts everyone already ignores.
If alert overload is your main pain, our guide on alert noise reduction goes deeper.
3. Root Cause Hints
In a system with many moving parts, finding the source of a problem means tracing back through everything that touches it. Doing that by hand across logs, metrics, and traces is slow and easy to get wrong.
Why it matters: most of your incident time goes into finding the cause, not fixing it. Cut the finding and you cut the whole curve.
What it does: correlates data across sources and surfaces the most likely origin.
A real example: it links a latency spike to a recent deployment that changed how the database was being queried.
What you get: a probable component to check first, instead of a blank screen and a guess.
Our breakdown of root cause analysis covers the method behind this.
4. Predictive Monitoring
AI does not only catch what is breaking now. It warns you about what is about to. By reading trends in your data, the platform flags a problem while you still have room to act.
Why it matters: a fix on your own schedule is cheap. A fix during an outage is expensive.
Disk space: it predicts a volume filling up days ahead, so you expand it during a maintenance window.
Network: it forecasts congestion during expected peak times.
SLAs: it flags a metric heading toward a breach while you can still react.
5. Continuous Learning, Not One-Time Tuning
The point of the four above is that the platform keeps adjusting. Your environment changes every week, so a baseline set once is wrong by next quarter. Good AI-powered observability re-learns normal as you deploy, scale, and shift load.
This is where vendors actually differ:
Some run fixed thresholds with a thin machine learning layer on top and call it AI.
Others run continuous learning across every signal type.
When you evaluate tools, ask which one they actually do. Push for specifics, not slogans.
Want to see this on your own data? You can start a free ObserveOps trial and point it at a slice of your environment to watch the baselines form.
AI-Powered Observability vs AIOps vs AI Observability
These three terms get used as if they mean the same thing. They do not, and the difference matters when you are deciding what to buy.
AI-powered observability is the broad one. It means using machine learning across all your observability data (metrics, logs, flows, traces, topology) to detect anomalies, correlate alerts, predict issues, and cut noise. That is the subject of this whole guide.
AIOps is narrower and older. It usually centers on alert correlation and event management, pulling related incidents together so teams focus on what matters. It is a big part of AI-powered observability, not all of it. See our explainer on what AIOps is.
AI observability is the confusing one, because it points the other way. It usually means watching your AI workloads: whether your large language models hallucinate, how many tokens they burn, and whether a model drifts over time. Real discipline, different job, different tools.
A quick way to tell which one you need:
Problem is alert noise and slow root cause across your infrastructure? You want AI-powered observability.
Problem is an LLM feature misbehaving in production? You want AI workload observability.
Plenty of teams go looking for the second and find they need the first more urgently. For more on where the lines sit, read our AIOps versus observability breakdown.
What are the Top Best Practices for AI-Powered Observability?
Buying a platform is the easy part. Getting value out of it is where teams stall. Here is what works.
1. Fix Your Data Before You Trust the AI
Machine learning is only as good as the data feeding it. Patchy inputs give you patchy insights.
Why: a platform that cannot see a service cannot baseline it, so a blind spot in your data becomes a blind spot in your alerts.
Take stock of what you actually collect today across metrics, logs, traces, and flows.
Close the obvious gaps before you switch on anomaly detection.
Standardize your naming and tags so the platform groups signals correctly.
A team that tagged its monitors by business service got useful correlation in weeks. A team with messy tags spent two months cleaning data before the AI earned any trust.
2. Start With Correlation, Not Prediction
Prediction is the flashy feature. Correlation is the one that pays off first.
Why: noise reduction gives your on-call team relief in week one, which buys you the goodwill to roll out the rest.
Turn on alert correlation across your noisiest services first.
Measure alert volume before and after, so you have a number to show.
Tune suppression rules for the recurring alerts everyone already mutes.
3. Keep a Human in the Loop Early
AI suggests the root cause. A human confirms it until the platform has earned trust on your environment.
Why: acting on an early, low-confidence hint can send you chasing the wrong fix, which is worse than no hint at all.
Treat root cause hints as a starting point, not a verdict, for the first month.
Note when the AI was right and when it was wrong, so you learn how far to trust it.
Hand more control to automated runbooks only after the hints prove reliable.
4. Connect AI Signals With Infrastructure Signals
If you do run AI workloads, do not silo their data. A spike in model latency might be a model problem, or it might be your inference server out of memory. You only know if you can see both at once.
Why: splitting observability into separate tools defeats the whole point, which is correlation.
Feed AI workload traces into the same platform as your infrastructure data where you can.
Use a platform that ingests OpenTelemetry, so app, agent, and server signals land together.
Build dashboards that show app, infra, and AI signals side by side.
5 AI-Powered Observability Tools and Platforms
Let’s understand the brief of the AI-powered tools that help for monitoring.
Tool | Best For | AI Approach | Honest Trade-Off | Pricing Note |
Motadata ObserveOps (recommended) | Enterprise and mid-market teams wanting metrics, logs, flows, traces, and topology in one place | Adaptive AI on DFIT™, no pre-training or calibration window, runs across every signal | Built for unified IT observability, not pure-play LLM output grading | Subscription, tiered by environment size. 30-day free trial, no card |
Dynatrace | Very large enterprises already standardized on it | Mature platform with a strong AI engine | High-end pricing prices out many mid-market teams | Premium tier of the market |
Datadog | Teams already using Datadog | AI features layered across broad platform coverage | Cost climbs fast as data volume grows | Bill surprises teams that do not watch ingestion |
New Relic | Teams wanting a strong all-rounder | AI anomaly detection, alert correlation, plain-language query assistant | Total cost depends heavily on data volume and seats | Volume and seat based |
Grafana Cloud | Extending an existing Grafana and Prometheus setup | AI features added on top of the open-source stack | Lighter on deep, out-of-the-box AI correlation | Open-source core, paid cloud tiers |
How to Start With AI-Powered Observability in Six Steps
Starting from zero? This is the sequence that works.
Step 1: Name the problem before the tool. Is your pain alert noise, slow root cause, or surprise outages? Pick the sharpest one. Buying before you name it is how teams end up with three overlapping platforms.
Step 2: Audit your data. List what you collect across metrics, logs, traces, and flows, and where the blind spots are. The AI only sees what you feed it.
Step 3: Turn on correlation first. Point it at your noisiest services. Measure alert volume before and after, so you have proof for leadership.
Step 4: Add anomaly detection on critical signals. Start where a slow degradation would hurt most, and let the baselines form before you trust the alerts.
Step 5: Layer in prediction. Once the first two are earning trust, switch on forecasting for the resources where running out is expensive, like disk and bandwidth.
Step 6: Close the loop. Connect the platform to your service desk so a confirmed anomaly opens a ticket on its own. This is where detection turns into resolution instead of just another dashboard.
That is the starter kit. Extend from there based on what your own data shows, not what a vendor calendar invite suggests.
Start Implementing AI-Powered Observability Today
The shift underneath all of this is simple. Old monitoring told you what broke. AI-powered observability tells you why, folds the noise into one clear story, and increasingly warns you before anything breaks at all.
That is the move from reactive firefighting to proactive operations, and it is becoming the default rather than the exception.
Here is the trade-off worth sitting with. No platform fixes bad inputs or a fuzzy problem. The AI is only as good as the data you feed it and the clarity of the pain you are trying to solve.
So start with one sharp problem, clean up your data, and let the results decide your next move.
Get this right and you end up watching your infrastructure, applications, and workloads from one place, with the AI carrying the noise reduction and correlation so your engineers spend their time fixing instead of sorting.
That is hours handed back to the people you cannot afford to lose to alert triage.
If you want to see whether the same holds on your own stack, you can start a free ObserveOps trial and run a week of your real alert volume through it.
FAQ
Is AI-powered observability the same as AIOps?
Not quite. AIOps usually focuses on alert correlation and event management. AI-powered observability is broader and also covers anomaly detection, prediction, and noise reduction across metrics, logs, flows, and traces. AIOps is a major part of it, not the whole thing.
Is It the Same as AI Observability?
No, and this trips up a lot of searches. AI-powered observability means AI watching your IT stack. AI observability usually means watching your AI models and agents for things like hallucinations and token cost. Different job, different tools. Most IT teams need the first one before the second.
Can a Small Team Benefit, or Is This Only for Large Enterprises?
Small teams benefit most from alert correlation and noise reduction, because they have the fewest people to absorb alert fatigue. You do not need the full feature set on day one. Start with correlation on your noisiest services and grow from there.
What Is the Most Common Mistake Teams Make?
Buying before defining the problem. Teams license a platform expecting it to fix everything, skip the data audit, and never roll it out fully. Fix your data, start with one clear pain point, and prove the value there before expanding.
Author
Jagdish Sajnani
Senior Content Strategist
Jagdish Sajnani is a B2B SaaS content strategist and writer. He has experience across different B2B verticals, including enterprise technology domains such as IT Service Management, AI-driven automation, observability, and IT operations. He specializes in translating complex technical systems into structured, engaging, and search-optimized content. His work improves product understanding, strengthens organic visibility, and supports B2B demand generation.