10 Best Network Performance Monitoring Software for 2026
Almost every network monitoring tool on the market promises the same few things, which is full visibility, faster root cause, and fewer pointless alerts.
Spend enough time looking into them and the websites all start to sound the same, and most of them read better on the page than they hold up on the day the network actually slows down.
So instead of trusting the feature lists, we looked into what each tool really offers, what real users say about them, and how each one holds up when something goes wrong and everyone is waiting on an answer.
This guide is what came out of that research, which is ten network performance monitoring tools ranked on one thing: how fast they take you from "something is slow" to the exact device, connection, or app behind it.
Because an alert on its own tells you very little. The cause could be a switch three hops away, a cloud path you never check, or an app quietly resending data in the background, and all that really matters is how fast the tool leads you to the source.
One thing we should say upfront is that we build one of the tools on this list, so keep that in mind as you read, though every tool here was judged by the same criteria before ranking it, ours included.
Let’s now understand what network performance monitoring means.
What is Network Performance Monitoring Software?
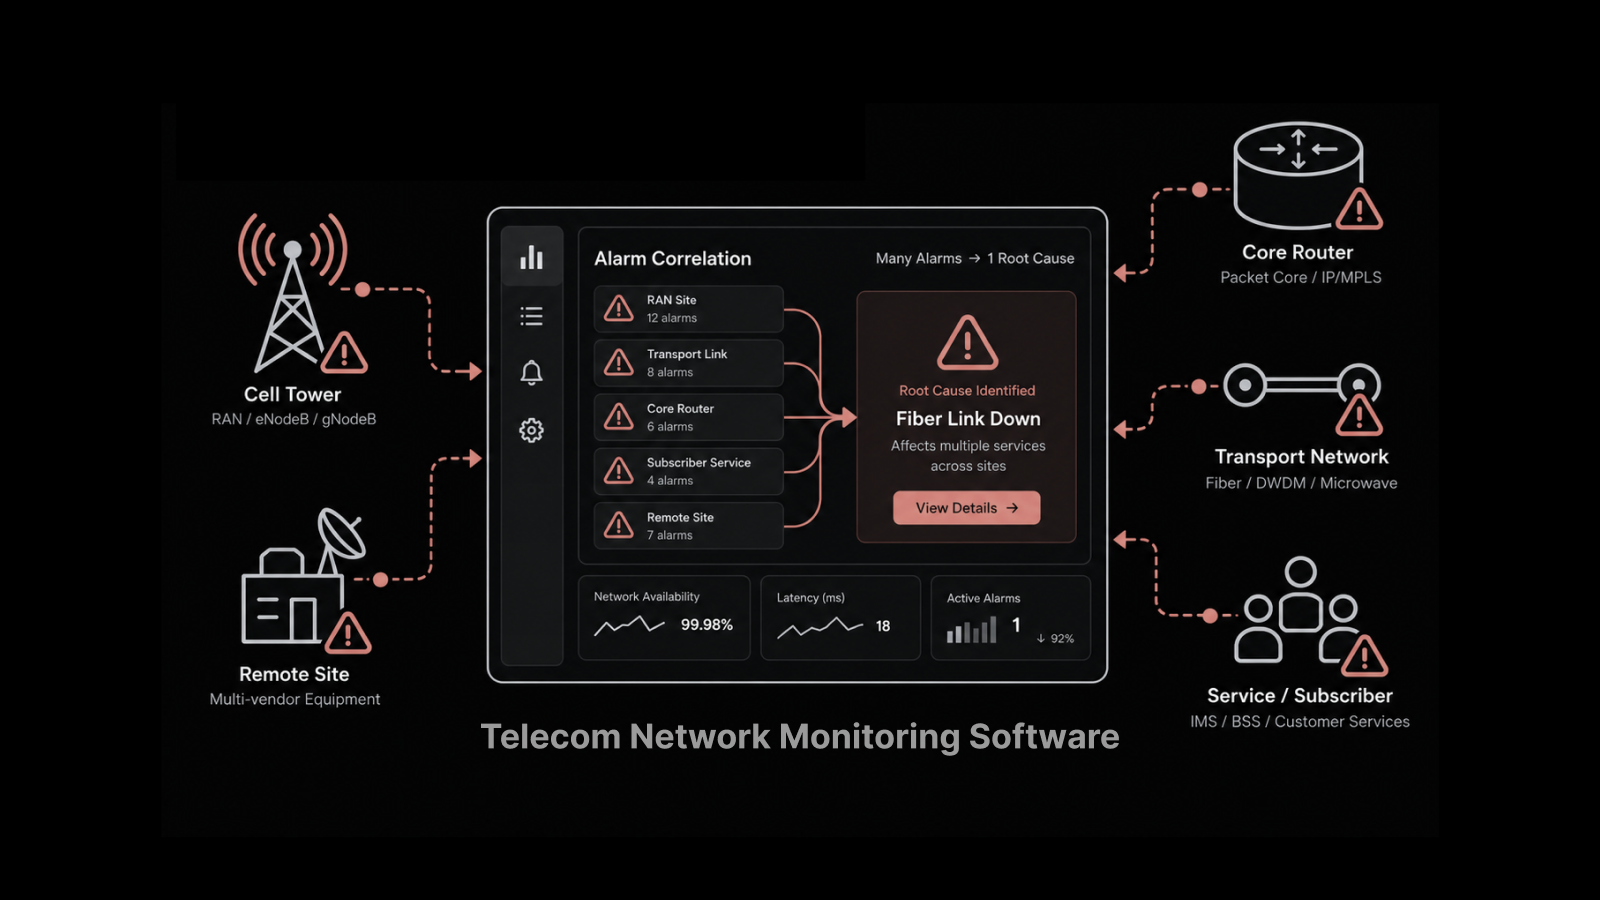
Network performance monitoring software is a tool that continuously watches the devices, links, and traffic on a network.
It catches slowdowns and failures before users report them. To do this, it collects data from routers, switches, firewalls, servers, and access points. It then turns that data into dashboards, alerts, and reports.
These tools pull data through a mix of protocols. SNMP polls devices for health and interface statistics. NetFlow, sFlow, and IPFIX reveal how traffic actually moves across the network.
ICMP, better known as ping, checks basic reachability. The stronger tools add network flow analysis. This shows you which users and applications consume the bandwidth, rather than only whether a link is busy.
The goal of all this is to shorten the distance between a problem and its cause.
The right network performance metrics matter here, and these include latency, packet loss, jitter, and bandwidth utilization.
A tool that tracks them turns a vague slow-network complaint into a specific fix on a specific device.
How We Evaluated These Network Monitoring Tools
We compared these tools against the same set of criteria so the rankings would mean something.
Instead of scoring on feature counts alone, we looked at how each tool performs on the things that matter when a real network problem lands on your desk.
We weighed each tool on five criteria.
Discovery and mapping: Can it find the devices and draw the Layer 2 and Layer 3 relationships without hours of manual entry?
Protocol coverage: SNMP and ICMP are the baseline. We looked for NetFlow, sFlow, IPFIX, WMI, and syslog support as well.
Correlation depth: When a link reaches capacity, does the tool connect the flow, the device, and the affected service, or does it fire separate, disconnected alerts?
Alert quality: How much noise does it generate, and can it suppress related alerts when one device goes dark?
Pricing clarity: Can you predict the bill as the network grows, or does the model hide surprises?
The prices below are the lowest published starting figure for each tool at the time of writing, and vendor quotes vary, so confirm your own numbers before you buy. Ratings come from G2 and Capterra.
Network Performance Monitoring Software Comparison Table
Here is the shortlist at a glance. Ratings are from G2 and Capterra. Prices are the lowest published starting figure for each tool.
Tool | Best For | Deployment | G2 / Capterra | Starts At |
Motadata ObserveOps | Unified metric, log, and flow observability | On-prem, cloud, hybrid | 4.6 / 4.7 | Custom quote (free trial) |
SolarWinds NPM | Detailed path tracing on large on-prem networks | On-prem, self-hosted | 4.3 / 4.5 | $1,638/year |
ManageEngine OpManager | SMB to mid-market SNMP and NetFlow | On-prem, cloud | 4.3 / 4.6 | $95 for 10 devices |
Datadog Network Monitoring | Cloud-native and Kubernetes teams | SaaS | 4.4 / 4.6 | $15/host/month |
Dynatrace | AI-driven full-stack observability | SaaS, managed | 4.5 / 4.5 | $7/host/month |
Splunk Observability Cloud | eBPF-based cloud network visibility with logs | SaaS | 4.3 / 4.5 | $15/host/month |
LogicMonitor | Agentless hybrid monitoring at scale | SaaS | 4.5 / 4.6 | $22/resource/month |
Progress WhatsUp Gold | Windows-centric SNMP environments | On-prem (Windows) | 4.4 / 4.5 | $1,229/year for 50 devices |
Paessler PRTG | Sensor-based, mixed-media networks | On-prem, cloud | 4.5 / 4.6 | $200/month |
Zabbix | Free, open-source monitoring | On-prem, cloud | 4.4 / 4.7 | Free (support from $325/month) |
10 Best Network Performance Monitoring Tools
Let’s learn different NPM tools that help you to pick the right software for your needs.
1. Motadata ObserveOps
Best for: Teams that want metrics, logs, and flows correlated on one platform.
Motadata ObserveOps is a unified observability platform that pulls metrics, logs, flows, traces, and topology into one place. It leads our list for a simple reason.
A network problem is rarely only a network problem, and a tool that speaks nothing but SNMP keeps sending you off to another screen to find out what actually went wrong.
What makes the difference here is triangulation.
ObserveOps lines up metric data, log data, and flow analytics side by side, so when a link hits capacity you see the interface metric, the flow responsible, and the log line from the affected service all in one view.
That is what takes a vague slow-application complaint down to a named cause, say a backup job saturating a link, in a few minutes instead of an afternoon spent jumping between tools.
Underneath, the platform runs on Motadata's DFIT deep-learning framework, which handles anomaly detection and alert correlation without the weeks of baseline training that some tools need first.
Additionally, auto-discovery uses CDP and LLDP to map how devices connect to each other, and flow analysis covers NetFlow, sFlow, jFlow, and IPFIX, with a Sankey view that makes traffic patterns easy to read at a glance.
Deployment is flexible too, with six modes that include high availability and disaster recovery, which matters for regulated industries that cannot move to pure SaaS.
And because it links natively to Motadata ServiceOps, an alert can turn into a support ticket on its own, so a detected fault becomes tracked work without anyone passing it along by hand.
Pros
- One platform replaces separate network, log, and flow tools, which lowers both cost and the effort of moving between screens
- Adaptive AI works without the weeks of calibration some competitors need
- On-prem, private cloud, and public cloud deployment suits regulated industries that cannot go pure SaaS
- Native ServiceOps integration turns alerts into tracked tickets without a manual handoff
Cons
- Public pricing is not listed, so you have to request a quote to compare on cost
- Setting up the look might take some time based on your organization needs and structure.
Pricing:
Custom quote, with a free trial available.
To view it mapped to your own workflow, you can book an ObserveOps demo and walk a real incident through it.
2. SolarWinds NPM
Best for: Detailed path tracing on large on-prem networks.
SolarWinds Network Performance Monitor is a long-established tool that many network engineers know well, and it holds a strong position for good reason.
Its NetPath feature traces the route to a service across each device along the way, including devices you do not own, which remains one of the clearest methods to prove that a delay lives with your internet provider rather than in your own rack.
Auto-discovery and dynamic topology maps are reliable, the device coverage is broad, and the community and documentation are extensive, so support is easy to find.
The limitations are cost and weight.
Much of the extended value comes from adding more SolarWinds modules, which raises both the price and the complexity of the deployment, and the interface can be heavy for a small team to manage.
Costs also climb quickly as the environment grows. It is a strong match for organizations with a dedicated network team and a large on-prem estate, and a weaker one for a lean crew that wants a light tool.
You can even read this guide to understand and know how both of these tools compare with each other in the Motadata vs SolarWinds comparison guide.
Pros
- Detailed path and diagnostic depth for complex on-prem networks
- Mature product with a large community and extensive documentation
- Broad device and vendor support
- Strong performance baselining and capacity planning reports
Cons
- Full value depends on buying additional modules, which raises the cost
- Interface and deployment are heavy for small teams
- Costs grow quickly as the environment scales
Pricing:
SolarWinds offers multiple pricing modules for each of its solutions. You can understand below.
Monitoring and Observability starts at $8 per month per node
Incident Response starts at $15 per node per month
3. ManageEngine OpManager
Best for: Small to mid-market teams that need reliable SNMP and NetFlow at a fair price.
ManageEngine OpManager is the value pick on this list.
It covers the fundamentals well, with multi-vendor SNMP monitoring, NetFlow-based traffic analysis through an add-on, automated discovery, and a large library of device templates that get you monitoring quickly.
Device-based licensing keeps the entry price low and predictable, and the tool scales from a single small network to larger multi-site setups.
For a mid-sized network, it does most of what the pricier suites do without an enterprise contract.
The limitations are worth knowing. Some of the more advanced traffic and application features live in separate ManageEngine modules, so the clean entry price grows as you add capability.
The interface is functional rather than modern, and reporting, while solid, is less flexible than what the enterprise suites offer.
For the money, though, it remains one of the most accessible tools here.
Pros
- Low starting price and transparent device-based licensing
- Quick to deploy thanks to the template library
- Scales from small networks to larger multi-site setups
- Workflow automation handles routine remediation without scripting
Cons
- Advanced traffic and application monitoring need extra modules
- Interface is dated next to SaaS-native tools
- Reporting is solid but less flexible than enterprise suites
Pricing:
Get a custom quote for the pricing. It depends on devices and number of licences.
4. Datadog Network Monitoring
Best for: Cloud-native and Kubernetes teams already running an observability platform.
Datadog Network Monitoring is a strong choice when your problems live in the cloud and your team already runs Datadog for metrics and traces.
Its Cloud Network Monitoring shows traffic between services, containers, and availability zones, which is the visibility a Kubernetes team needs and a traditional SNMP tool struggles to provide.
The interface is fast and modern, the integration coverage is deep, and network data appears next to traces and logs, so you investigate in one platform rather than several.
The honest downsides are cost and model. Datadog bills by host and by product, and network monitoring often comes as an add-on on top of infrastructure pricing, so the bill can grow in a manner that is hard to predict at scale.
The product is also more at home in the cloud than deep in an on-prem network closet, and its full value assumes you are already committed to the Datadog platform.
Pros
- Network context appears next to traces and logs in one platform
- Excellent for cloud-native and containerized environments
- Fast, modern interface with deep integration coverage
- Correlates network data with application traces for faster root cause
Cons
- Host-based and add-on pricing gets expensive and hard to predict at scale
- Less suited to deep on-prem device monitoring
- Full value assumes you are already committed to Datadog
Pricing:
The pricing of Datadog network monitoring starts at $15 per host per month.
5. Dynatrace
Best for: Enterprises that want AI-driven full-stack observability platforms for complex needs.
Dynatrace approaches the network through application context.
Its AI engine connects process communications, errors, and latency into cause-and-effect explanations, so instead of a raw interface counter you get an account of which service is struggling and why.
For application-centric teams that want automation and deep root-cause analysis, it is powerful, and it scales well for large, complex environments.
The limitation is that device-level SNMP monitoring is not its main focus.
Many buyers pair Dynatrace with a traditional network management system for full device coverage, and the licensing model can be complex for a team that only does network operations.
It is a good match for enterprises that prioritize application observability over device-by-device monitoring, and a weaker one for teams whose main need is classic network management.
Pros
- Strong automation and AI correlation reduce manual investigation
- Close application-to-infrastructure context
- Scales well for large, complex environments
- Single agent collects host, process, and network data together
Cons
- Device-level SNMP monitoring is not the primary focus
- Licensing and rollout are complex for pure network teams
- Often needs pairing with a dedicated network management system for full coverage
Pricing:
The Foundation starts at $7 per host per month.
6. Splunk Observability Cloud
Best for: Cloud teams that want eBPF-based network visibility tied to their logs.
Splunk Observability Cloud brings network visibility into a platform that many teams already use for log analytics.
Its Network Explorer, built on the eBPF technology Splunk gained through the Flowmill acquisition, captures fine-grained traffic data directly from hosts without any change to application code.
For a cloud-native environment, that host-level view of service-to-service traffic is useful, and the link between network data and Splunk log analytics is a real advantage if Splunk is already your center of gravity.
The downsides are familiar to anyone who has run Splunk. Cost can climb with data volume and is hard to forecast, and there is a real learning curve to getting value from the platform.
It is also less focused on traditional on-prem device polling than a dedicated network tool. It works best for teams whose data already lives in Splunk and who want network context alongside it.
Pros
- Deep cloud and container network visibility without code changes
- Fits naturally if you already run Splunk for logs
- Real-time analytics on high-cardinality data
- Open-standards ingestion avoids heavy vendor lock-in on data collection
Cons
- Costs rise with data volume and can be hard to forecast
- Steeper learning curve than single-purpose network tools
- Less focused on traditional on-prem device polling
Pricing:
Infrastructure starts at $15 per host per month.
7. LogicMonitor
Best for: Agentless hybrid monitoring at scale.
LogicMonitor is a SaaS platform built for hybrid environments that combine on-prem infrastructure with cloud services. It is agentless, which makes it quick to roll out across network hardware, and its predictive analytics help teams catch capacity problems early.
Out-of-the-box device and cloud coverage is broad, and because it runs as a service, you avoid maintaining your own monitoring servers. For a growing enterprise, it scales cleanly across a mixed estate.
The trade-off is that its pricing and feature depth target enterprise buyers, so smaller teams may find it more than they need.
Resource-based pricing is predictable once you understand it, but it takes a quote to learn your real number, and some of the advanced tuning carries a learning curve.
It is a strong fit for larger, hybrid organizations and a less natural one for very small teams.
Pros
- Quick to deploy with no agents on network devices
- Scales well for large, hybrid estates
- Reduces on-prem management overhead
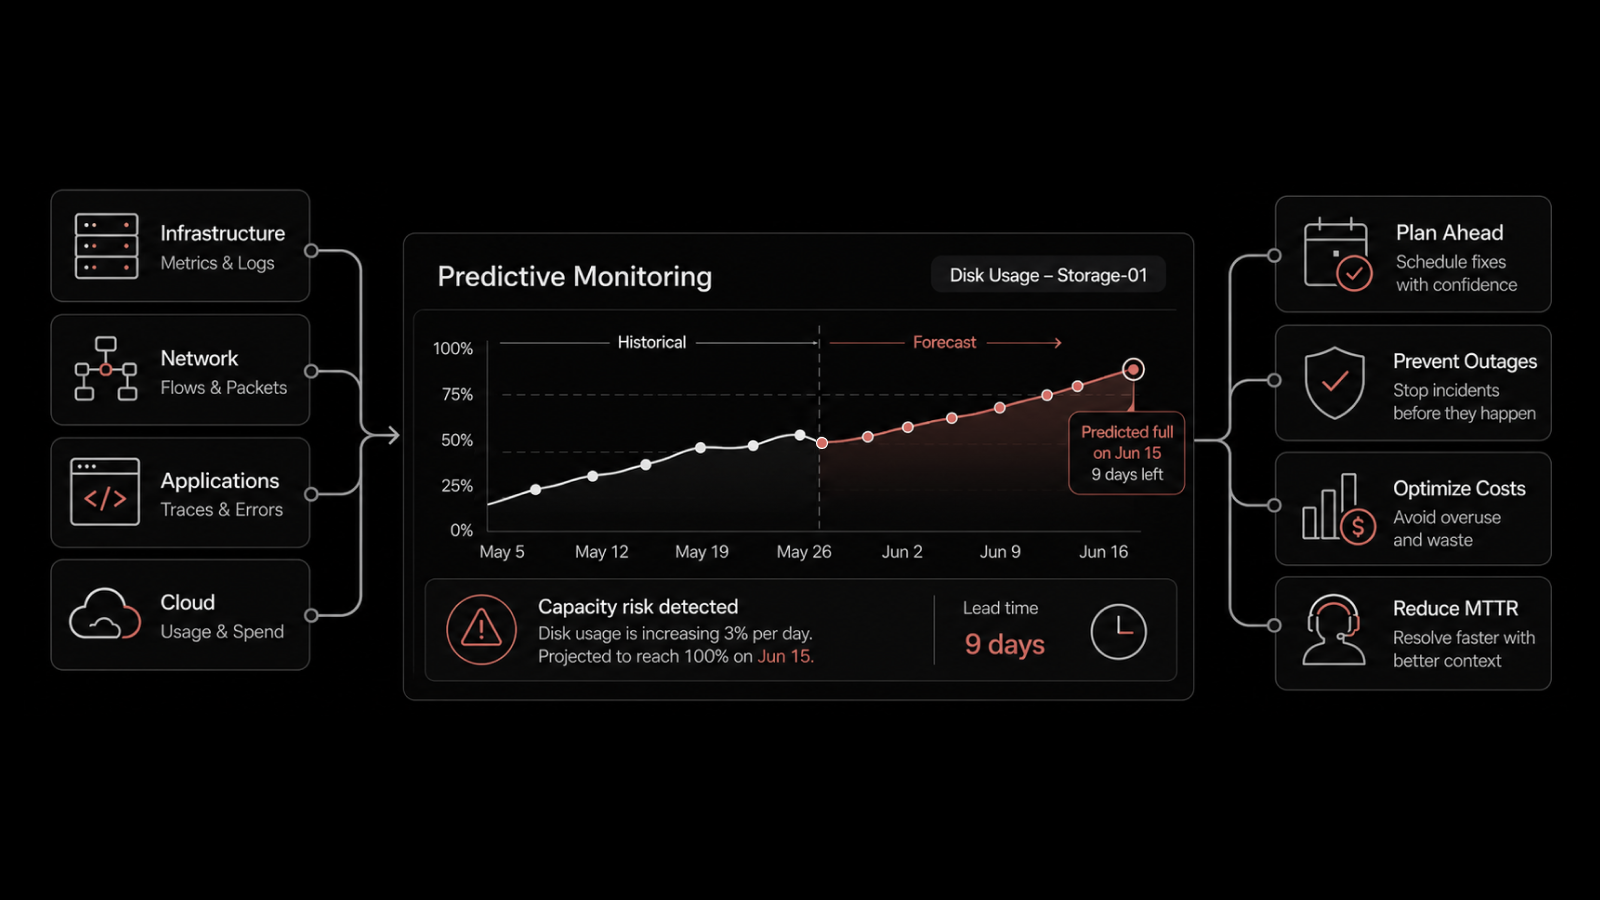
- Predictive alerts flag capacity issues before they cause outages
Cons
- Pricing and depth are geared to enterprise, not small teams
- Full cost needs a custom quote
- Some advanced tuning carries a learning curve
Pricing:
Starts at $22 per resource per month.
8. Progress WhatsUp Gold
Best for: Windows-centric SNMP environments that want a proper tool that helps them to monitor and observe networks without any hassle.
WhatsUp Gold is a long-standing network monitor that is quick to install and easy to read.
It covers SNMP-based device monitoring, discovery, mapping, and alerting, and it handles wireless networks alongside traditional wired LANs.
The dashboards and maps are clear, and the learning curve is gentle, which makes it a comfortable fit for a Windows team that wants results without a heavy rollout.
The main limitation is that it is an on-prem Windows Server product with no cloud-native version, so it is a weaker match for teams whose infrastructure has moved largely to the cloud.
Some capabilities also depend on add-on modules, which affects the final cost. Within its niche, though, it is dependable and approachable, and it serves small and mid-market Windows environments well.
Pros
- Simple to install and use, with a gentle learning curve
- Clear, readable dashboards and maps
- Good fit for Windows-centric SMB and mid-market teams
- Point-based licensing lets you monitor only what you need
Cons
- On-prem Windows only, with no cloud-native version
- Some features require additional modules
- Less suited to cloud-heavy environments
Pricing:
Starts at $1,229 per year for 50 devices.
9. Paessler PRTG
Best for: Sensor-based monitoring of mixed-media networks.
PRTG uses a sensor model, where each sensor watches one aspect of one device, for example a CPU load, a port, or a specific SNMP value. That granularity is its strength.
It combines SNMP, WMI, and packet sniffing to give a broad view, and it ships with prebuilt sensors for common vendors, so setup is quick.
For a small-to-mid network with mixed hardware, it is flexible and reliable, and it covers both wired and wireless environments.
The sensor model is also the catch. Pricing scales with the number of sensors you deploy, and a modern device can consume many sensors, so the total cost is easy to underestimate.
The full feature set also takes time to learn, and heavier deployments need careful sensor planning. It suits teams that want fine control and are willing to manage sensor counts closely.
Pros
- Fine-grained, flexible monitoring at the sensor level
- Quick setup with vendor-specific sensor templates
- Suitable for mixed wired and wireless environments
- Single tool covers network, server, and application sensors together
Cons
- Sensor-based pricing is easy to underestimate as devices grow
- Full feature set takes time to learn
- Heavier deployments need careful sensor planning
Pricing:
PRTG 500 starts at $200 per month.
We break down how it compares on our Motadata vs PRTG comparison.
10. Zabbix
Best for: Teams that want a capable tool at zero license cost.
Zabbix is the open-source option that holds its own against paid tools.
It monitors networks, servers, and cloud resources through both agent-based and agentless methods, supports auto-discovery and distributed monitoring, and carries no per-device license fee.
Development is active and the community is large, so help and templates are easy to find. For a team with the engineering time to run it, the value is hard to argue with.
The cost shows up elsewhere. Setup is complex, the learning curve is steep, and the tool is resource-intensive at larger scales, so a free license does not mean free to operate.
Many teams end up paying for a support subscription or a partner to implement it.
For the right team, it is both powerful and inexpensive. For a team without spare engineering hours, the total cost of ownership can be higher than it first appears.
Pros
- No per-device license cost
- Highly scalable and flexible for custom needs
- Active development and a large community
- Deep configuration control suits teams with specific requirements
Cons
- Steep learning curve and complex setup
- Resource-intensive at larger scales
- Real cost moves to engineering time or paid support
Pricing:
The open-source core is free, with paid support subscriptions starting at $325 per month.
How to Choose the Right Network Performance Monitoring Tool
The best tool depends less on feature counts and more on where your network runs and who manages it.
A few honest rules of thumb can shorten the list quickly, and our guide on how to choose a network monitoring system goes deeper if you want a full framework.
Mostly on-prem with a dedicated network team: You want a tool with strong on-prem, device-level monitoring, so your team can watch every device and link across the network. SolarWinds NPM and WhatsUp Gold fit well, and ObserveOps suits you too if you want logs and flows in the same view.
Cloud-native or Kubernetes-heavy: You want a tool that shows traffic between services and containers, which SNMP-only tools cannot do. Datadog and Splunk are built for this, and Dynatrace fits when application context matters most.
Hybrid, and you do not want to run monitoring servers: You want an agentless, SaaS-based tool that covers on-prem and cloud together, so you avoid the upkeep of your own monitoring servers. LogicMonitor and ObserveOps both handle mixed setups, and ObserveOps adds on-prem options for regulated industries.
Small or mid-market budget: You want solid coverage of the basics without an enterprise contract. OpManager and PRTG are affordable choices, though keep an eye on how PRTG's sensor pricing adds up.
The one question that cuts through most of this: do you need pure network monitoring, or do you need to connect network problems to application and log data?
If it is the second, a unified platform saves you from buying and joining three tools later.
Choose the Right Network Performance Monitoring Tool for Your Requirements
In concluding notes, we would say that the right pick is the one that matches your network, your team, and your budget.
If your hardest incidents keep turning into a search across three separate tools, a unified platform is worth the switch, and that is why we place Motadata ObserveOps first.
It correlates metrics, logs, and flows in one place, runs its AI without weeks of training, and deploys on-prem, in the cloud, or in a hybrid model, which covers most real-world environments.
To test unified observability against your own traffic before you commit, you can start a free ObserveOps trial and run a real incident through it with your team.
FAQs
What Is the Best Network Performance Monitoring Software?
There is no single best tool for everyone, because the right choice depends on your environment. For unified metric, log, and flow observability, Motadata ObserveOps is our top pick. For detailed on-prem path analysis, SolarWinds NPM leads, and for cloud-native teams, Datadog is strong. Match the tool to your network rather than to its reputation.
What Is the Difference Between Network Performance Monitoring and APM?
Network performance monitoring watches the network layer, which covers devices, links, traffic, latency, and packet loss. Application performance monitoring watches the application layer, which covers response times, error rates, and traces inside your code. They answer different halves of the same question, which is why a slow application often needs both. A unified platform like ObserveOps carries both, so you do not have to guess which layer failed.
Which Protocols Should a Network Monitoring Tool Support?
At a minimum, look for SNMP and ICMP, which is ping, for device health and reachability. For traffic visibility, you want NetFlow, sFlow, or IPFIX. WMI helps with Windows monitoring, and syslog matters for log collection. A tool that only handles SNMP leaves real blind spots on traffic and application behavior.
Should I Choose Cloud or On-Prem Network Monitoring?
It depends on where your infrastructure and your compliance rules stand. Cloud-based tools like Datadog and LogicMonitor remove the need to run monitoring servers and match cloud-heavy estates. On-prem tools give you control and are sometimes required in regulated industries. ObserveOps supports on-prem, cloud, and hybrid, which helps when you are somewhere in between or moving from one model to the other.
How Much Does Network Performance Monitoring Software Cost?
Prices vary widely. Open-source Zabbix is free to license, mid-market tools like OpManager start at $95 for 10 devices, and enterprise products like SolarWinds NPM start at $1,638 per year and rise with scale. SaaS tools bill by host or resource, which can be harder to predict. Motadata ObserveOps is priced on a custom quote, so the cost reflects your actual environment rather than a fixed tier, and a free trial lets you test it before you commit. Whichever tool you consider, get a quote for your real device or host count first.
Author
Jagdish Sajnani
Senior Content Strategist
Jagdish Sajnani is a B2B SaaS content strategist and writer. He has experience across different B2B verticals, including enterprise technology domains such as IT Service Management, AI-driven automation, observability, and IT operations. He specializes in translating complex technical systems into structured, engaging, and search-optimized content. His work improves product understanding, strengthens organic visibility, and supports B2B demand generation.