Introduction
Your AWS environment is a living, breathing ecosystem—constantly scaling, adapting, and processing trillions of requests daily.
However, even the most resilient cloud infrastructure can suffer from hidden inefficiencies, security gaps, and rising costs without the proper monitoring strategy. With 94% of enterprises relying on cloud services, proactive monitoring isn’t just best practice—it’s a competitive advantage.
This blog will dive into why AWS monitoring matters, and the best practices to keep your cloud infrastructure running at peak efficiency.
What is AWS Monitoring?
AWS monitoring is process where you will have a detailed view of how Amazon Web Services (AWS) resources perform. The monitoring process helps find problems before they become big, ensure resources are used well, and keep services running. Tracking CPU usage and latency metrics is crucial for a healthy AWS infrastructure.
Why is AWS Monitoring Important?
AWS monitoring is vital for keeping your applications and infrastructure on the AWS cloud reliable, secure, and efficient. Without good tracking, companies can have performance issues, face security problems, and incur higher costs. By monitoring actively, teams can find unusual activities and problems early. This helps them act quickly.
In short, intense AWS monitoring leads to better application performance, more innovative use of resources, and improved security. Therefore, a safe AWS infrastructure plays a vital role in providing better user experience.
Best Practices for AWS Monitoring
Building a robust AWS monitoring strategy requires aligning best practices with your business objectives. When implemented effectively, these practices enhance performance, strengthen security, and optimize costs, ensuring your cloud environment operates at peak efficiency.
By taking a proactive approach to monitoring, you can gain deeper visibility, detect issues early, and make data-driven decisions to improve reliability and scalability.
Let’s explore the key best practices that can elevate your AWS monitoring strategy.
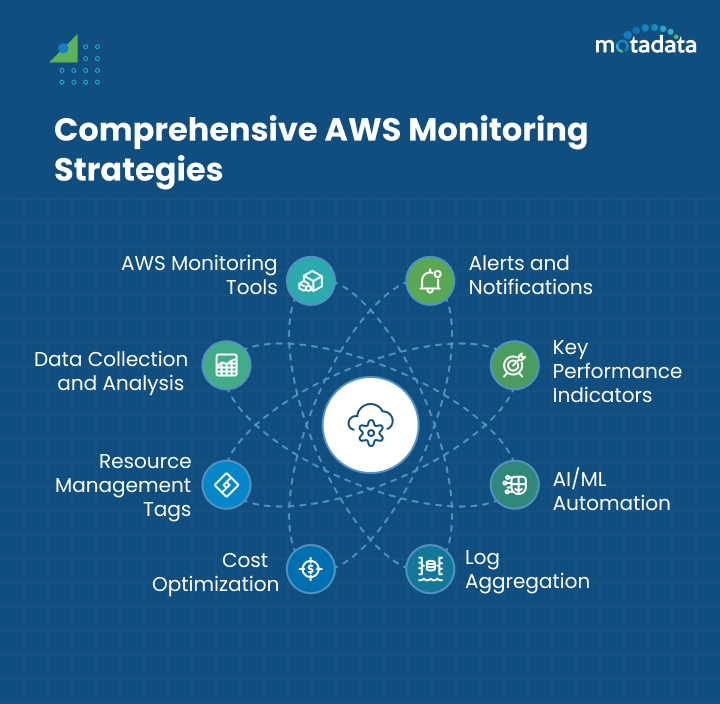
1. Setting up alerts and notifications
Timely alerts and notifications are very important for a good monitoring plan. They give quick insights into possible problems and help stop minor issues from growing into significant disruptions.
Set up your monitoring tools to send alerts when certain limits are crossed. This can be anything like unusual CPU spikes or low disk space. You can also customize how you get notifications. You could choose email, SMS, or systems like PagerDuty. This helps ensure the right teams know about issues quickly so they can fix them quickly.
By creating alerts for security problems, performance issues, or strange patterns in your AWS service, you help your teams act quickly and keep your AWS environment stable and safe.
2. Defining key performance indicators (KPIs)
Key Performance Indicators (KPIs) are essential to check that AWS Monitoring works well. These indicators help us understand different things, like how much AWS resources we use, the applications’ performance, and the users’ experience. Companies can improve their AWS environment by monitoring API calls, memory usage, and network traffic KPIs.
KPIs also help find and fix performance issues quickly, maintaining services and ensuring excellent customer experiences. Using KPIs helps match monitoring plans with business goals, improving the overall performance of AWS infrastructure.
3. Automating monitoring with AI/ML
In our world of growing data, monitoring everything by hand is no longer effective or practical. Artificial intelligence (AI) and machine learning (ML) can improve your AWS monitoring with predictive analysis and anomaly detection.
AI and ML can look at past data to set performance standards. They can find unusual patterns and possible problems before they cause issues for your application or users. This lets you fix problems early and keep your system stable. You can use AWS services, like AWS Lambda, to automate these machine-learning tasks and improve your monitoring.
When you use AI and ML, your monitoring system can handle large amounts of data, spot complex patterns, and predict future issues. This allows your teams to focus on more critical projects.
4. Log aggregation and anomaly detection
Log data from different AWS services gives you essential information about how your system works and any problems. This is why log aggregation is key for good AWS monitoring.
Bringing together logs from many sources lets you analyze them in one place. This full view helps you find any unusual activities.
By looking at log patterns, you can spot odd trends or actions that could mean a problem. For example, you can notice unauthorized login attempts or strange API call patterns by checking the logs.
You can use tools like AWS CloudWatch Logs or look at third-party log management options to quickly gather, store, and analyze your AWS log data for better insights.
5. Cost Optimization of Monitoring
While comprehensive AWS monitoring is essential, keeping AWS cloud costs in check is crucial. An effective monitoring strategy should be cost-effective.
Implement a cost optimization strategy right from the start. Start by choosing the proper monitoring services and tools that align with your budget and requirements. Right-sizing your monitoring tools and leveraging tiered storage options can save significant costs.
Here’s how to categorize your monitoring data to optimize costs:
| Data Type | Storage Tier | Cost Implication |
|---|---|---|
| Real-Time Metrics | Hot Storage | Highest Cost |
| Historical Metrics & Logs | Cold Storage | Lower Cost |
| Archived Data | Archival Storage | Lowest Cost |
Regularly review your monitoring setup, identify and eliminate redundant metrics or logs, and use AWS cost optimization tools to ensure you get the most value out of your investment.
6. Utilizing Tags for Effective Resource Management and Monitoring
In the fast-changing world of AWS, managing many resources well means you need a good tagging strategy. Tags help you sort and organize AWS resources based on purpose, owner, environment, or other vital details.
It’s essential to use a tagging policy consistently in your AWS environment. Tags give helpful context for the data you monitor.
This method simplifies tracking and analyzing specific resources or groups’ performance. For instance, you can quickly filter and check the performance of all resources marked with “Production” or “Development.”
When you add tagging to your best AWS practices, you get a clearer view of how resources are used. It also helps you allocate costs better, improve performance, and boost security monitoring.
7. Collect and Analyze Data from All Areas of Your AWS Environment
Modern applications often use many AWS services, creating a lot of data. Gathering and analyzing data from all parts of your AWS environment is essential to understanding AWS performance and resolving application issues, security, and cost efficiency.
Don’t just focus on a few key metrics. Take a broader approach by collecting data from various sources like CloudTrail, VPC Flow Logs, and custom application logs. A centralized monitoring dashboard can help you visualize this data. This will make it easier to see correlations and patterns.
You will understand your AWS environment better by putting all the pieces together. This knowledge allows you to make smarter decisions about optimization and resource allocation.
8. Use the Right AWS Monitoring Tools
There is no one answer for AWS monitoring. The secret is to pick the right tools for what AWS customers need. Amazon CloudWatch has many monitoring services, but other tools also offer unique features.
First, think about what you need. Do you want detailed application performance monitoring? Are you working with a hybrid cloud setup? Look into tools that fit well with your current workflow. Tools like Datadog, New Relic, and Dynatrace provide advanced functions. They include things like distributed tracing, real-user monitoring, and synthetic monitoring.
When you create a custom monitoring toolkit that fits your needs, you give your teams great insights. This will also improve your overall AWS management strategy.
Conclusion
In conclusion, using these AWS monitoring best practices will improve the efficiency and performance of your AWS cloud monitoring environment. You can set up alerts and define your KPIs.
Leverage AI/ML automation and optimize costs to ensure you can respond quickly to any issues. Use tags for better resource management and choose the right tools to monitor your AWS infrastructure effectively.
Remember that ongoing monitoring and analysis are essential for keeping your AWS environment healthy and secure. Stay proactive, and keep improving your monitoring strategies to stay ahead in 2026 and beyond.
FAQs:
AWS monitoring is the ongoing process of collecting and analyzing data from different AWS resources and applications in the Amazon cloud by the AWS Shared Responsibility Model. It helps you understand how healthy, secure, and well your cloud infrastructure is. You can see your AWS environment clearly by monitoring key metrics, logs, and events. This lets you find and fix potential problems before they affect your users.
It also means using different tools and methods to monitor the performance of your applications and the performance of your Amazon Web Services (AWS) setup, including the applications that run on it, such as utilizing Elastic Load Balancing. This includes monitoring AWS resources like EC2 instances, S3 buckets, and RDS databases.
Several AWS services, including Amazon Elastic Container Service (ECS), are essential for monitoring your AWS environment, including Amazon ELB. Amazon CloudWatch tracks metrics and logs. AWS CloudTrail records API call history. Amazon ECS helps monitor containers. AWS Lambda allows for custom monitoring functions. AWS Fargate is used to monitor serverless applications.
You can set up monitoring alarms easily. You can do this through the AWS Management Console or the AWS SDKs. To set up an alarm in the console, go to the AWS service you want. Then, choose the metric you’d like to monitor. After that, adjust the alarm’s threshold and notification settings.
AWS Organizations helps you manage and monitor several AWS accounts from one place. You can collect data and set up cross-account monitoring using tools like AWS Security Hub, which aggregates security alerts and provides insights from Amazon Inspector. This makes it easier to manage access across your organization. You will get a clear view of your AWS platform, which improves the user experience.
AWS monitoring helps you see any performance issues. You can find where improvements are needed by looking at data from AWS cloud resources, like CPU utilization, memory usage, Amazon EBS volumes, and network traffic. Additionally, integrating Amazon CloudFront can help in optimizing content delivery. To maximize performance, you can resize instances, improve database queries, and enhance application code. This process can lower AWS costs and provide a better experience for end users.
The key benefits of AWS monitoring are better application availability and a better user experience. It also improves AWS security and helps find and fix performance issues before they affect your processes. Plus, you get a thorough view of your AWS infrastructure.
Amazon CloudWatch is all about monitoring how well your systems are running. It gathers metrics, logs, and events from your apps and AWS services. On the other hand, AWS CloudTrail tracks the API calls made in your AWS account. It serves as a security check and access management record, meeting compliance needs.


