journalctl Command in Linux: How to Filter, Tail and Export systemd Logs
Why does a service fail overnight and leave almost nothing useful behind in /var/log? On most current Linux distributions, the text file you are reading was never the primary record of what happened. systemd captured the event first, and journalctl is how you get it back.
That matters well beyond the terminal. The minutes an engineer spends hunting for the right log, and the weeks of history a server quietly discards on default settings, turn into longer outages and audit questions nobody can answer.
The systemd journal stores every message as a structured entry with the unit, process and boot already attached, which is what makes precise queries possible. Knowing how to ask for exactly what you need is the groundwork for Linux log management at any scale.
In this blog, you will see:
What the systemd journal stores and where it keeps it
How to use journalctl to filter by service, time range, boot and priority
How to tail journalctl output live and search inside it
How to export entries to JSON for analysis or forwarding
How to clear journalctl logs and cap disk consumption
Why journald silently drops messages, and what that costs when it happens
What Is journalctl and How Does the systemd Journal Work?
journalctl is the command line utility that queries the systemd journal, the structured log store maintained by the systemd-journald service on every systemd based Linux system. It reads binary, indexed journal files rather than plain text, which is why filtering by unit or time range returns results without a full scan.
The use of journalctl comes down to answering three questions quickly: what failed, when it failed, and what else the system was doing at that moment. You can find journalctl at /usr/bin/journalctl on any systemd host, since it ships with systemd itself and needs no separate install.
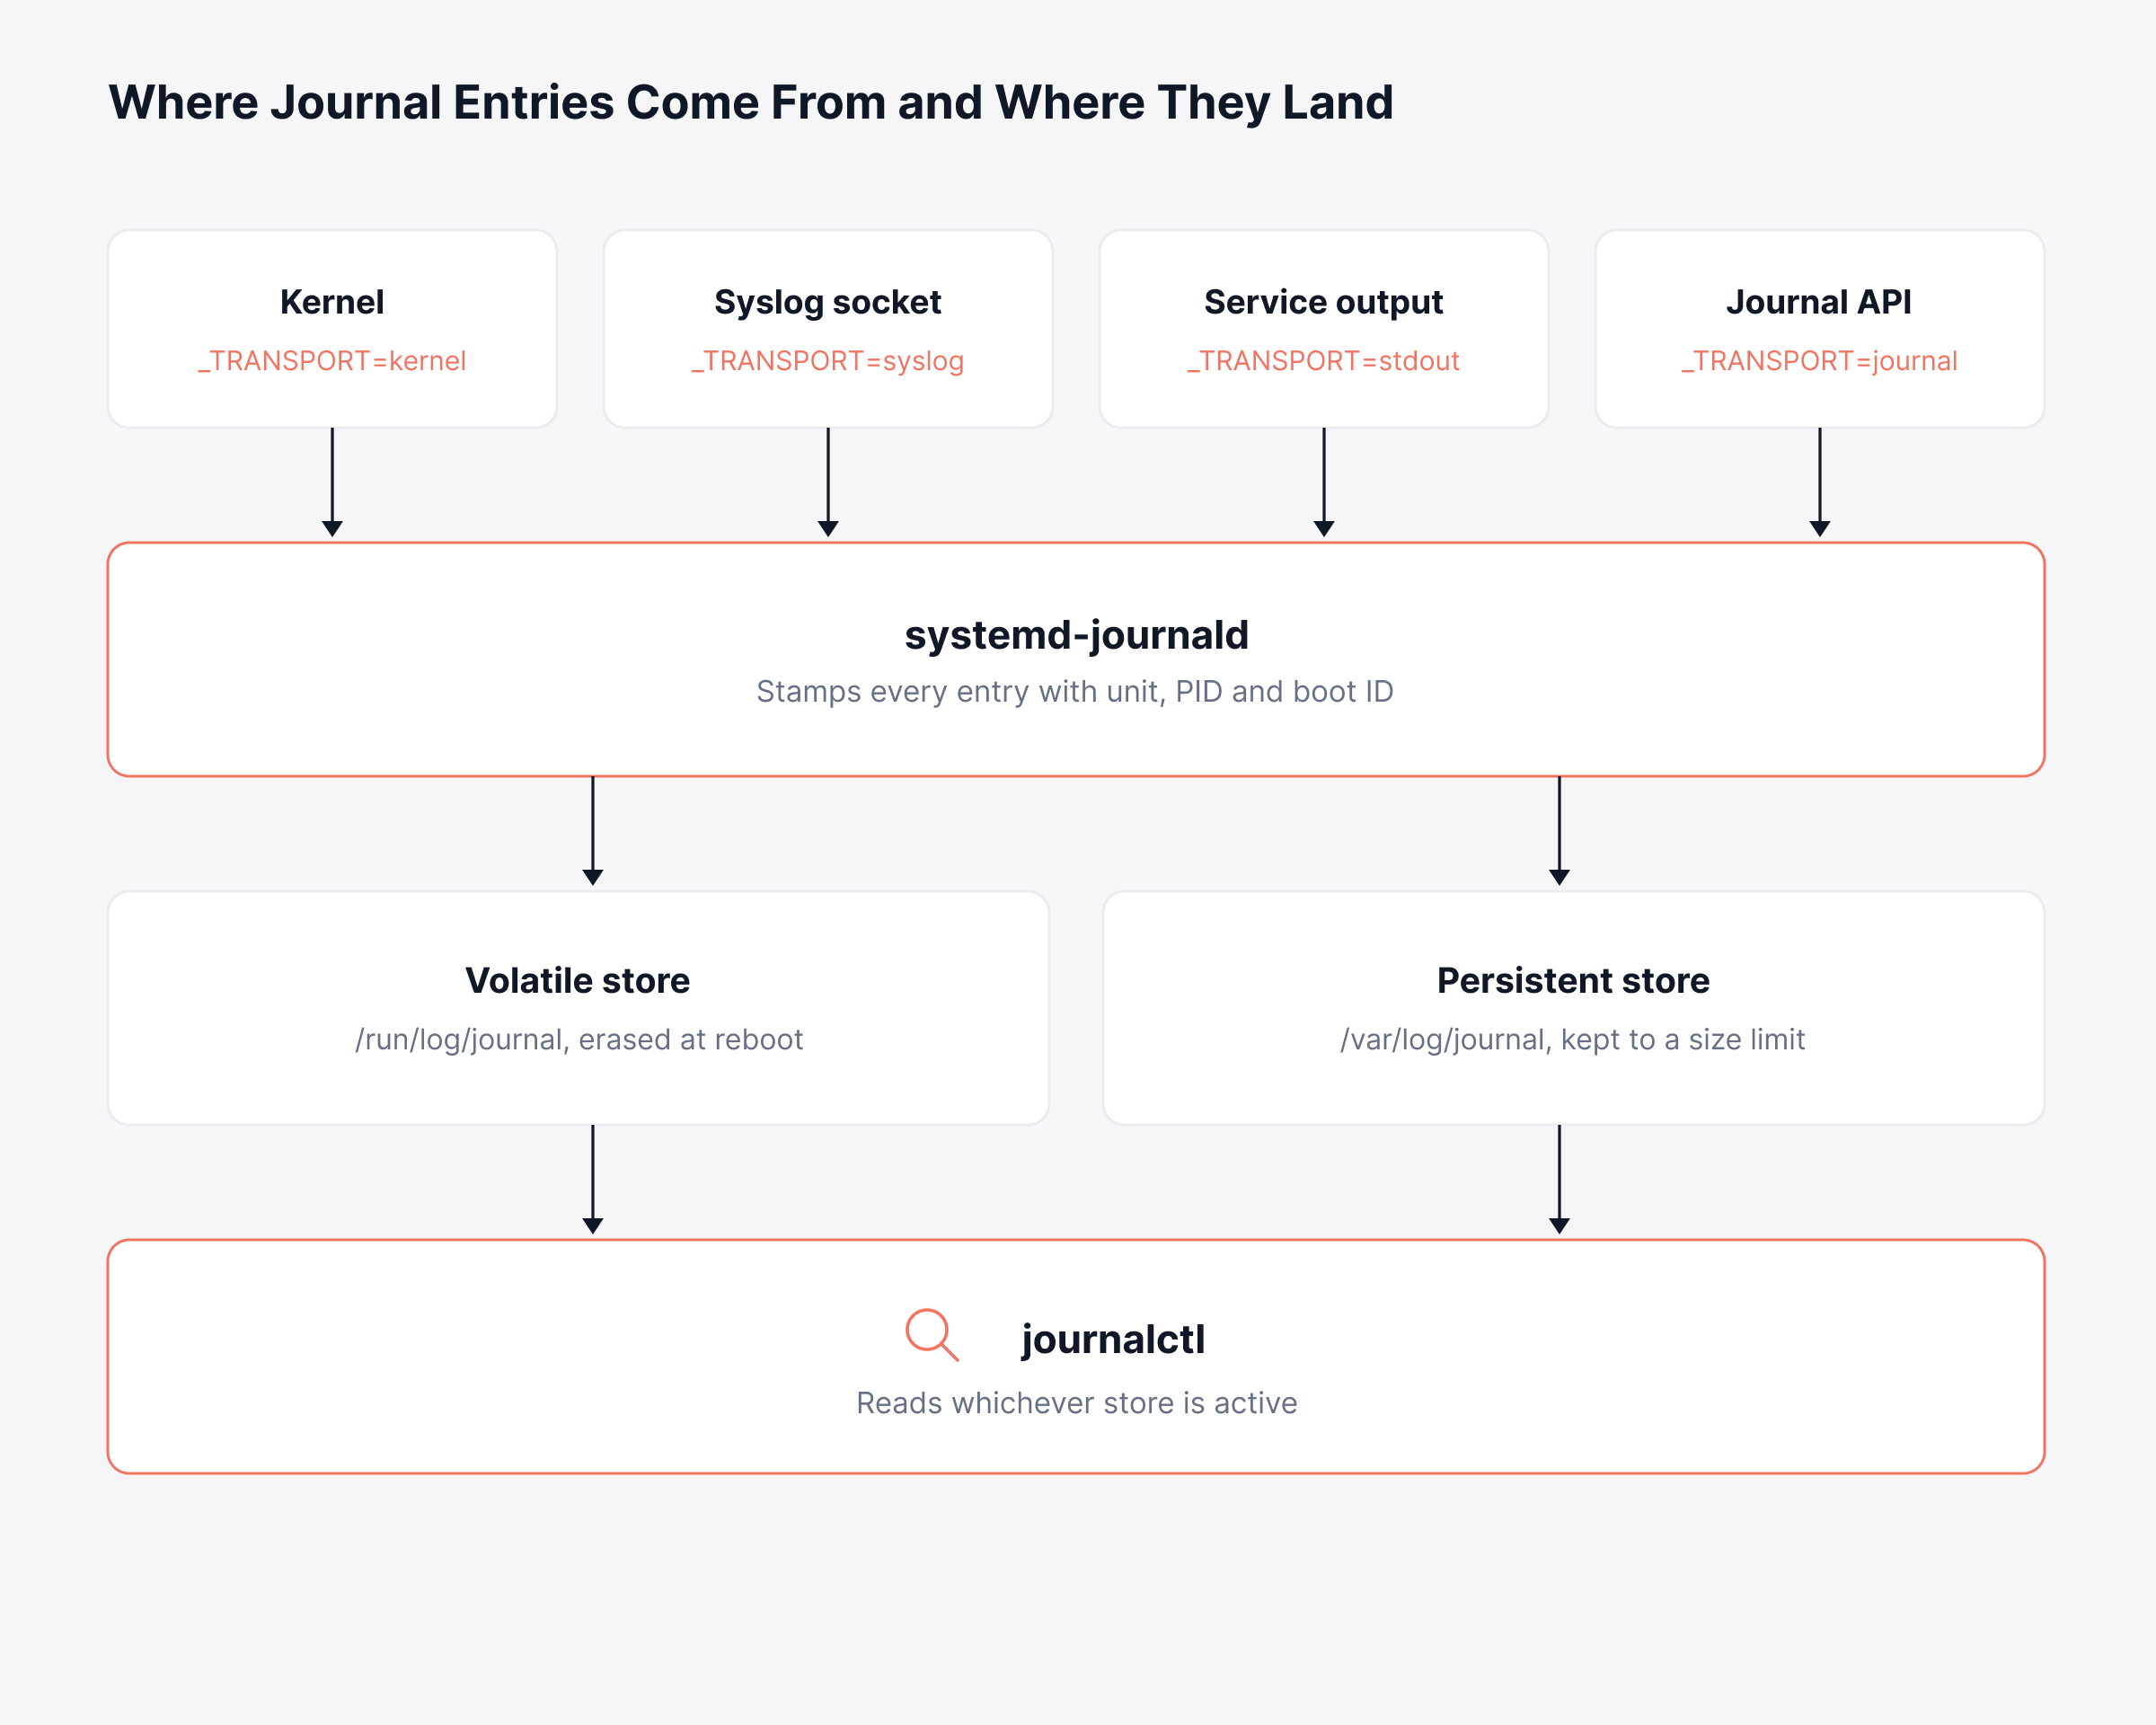
journald collects from several inputs at once:
Kernel ring buffer: The same source dmesg reads
Syslog socket: Messages from anything writing to /dev/log
Service output: Standard output and standard error of every unit systemd starts
Native journal API: Applications that log structured fields directly
Audit subsystem: Kernel audit records where auditd forwarding is enabled
Every entry arrives with metadata that journald attaches itself. An application can write anything it likes in the message text, but the process ID and unit name recorded beside that message come from journald and cannot be faked.
Knowing which input a message arrived through tells you which filter will find it again. The diagram stacks the four sources journald accepts, the transport value each one stamps on an entry, and the two stores those entries can land in.
Where the Journal Stores Its Data
Storage location decides whether your logs survive a reboot, and the default on several distributions is not persistent.
Volatile: Entries live in /run/log/journal, which is memory backed and cleared on every restart
Persistent: Entries live in /var/log/journal and survive reboots up to the configured size limit
The Storage= directive in /etc/systemd/journald.conf controls this and accepts four values:
auto, which writes persistently only if /var/log/journal already exists
persistent, which creates the directory and always writes to disk
volatile, which keeps everything in memory
none, which discards entries after forwarding
To switch a machine to persistent storage:
sudo mkdir -p /var/log/journal
sudo systemd-tmpfiles --create --prefix /var/log/journal
sudo systemctl restart systemd-journald
How journalctl Compares to systemctl, dmesg and tail
Each tool reads a different slice of the same system. The table shows what each one covers, so you can see what the more familiar commands leave out.
Command | What it reads | Survives reboot | Filtering available |
journalctl | Full systemd journal across all sources | Yes, with persistent storage | Unit, time, boot, priority, any metadata field |
systemctl status | Last ten journal lines for one unit | Yes, but truncated | Nothing beyond the unit itself |
dmesg | Kernel ring buffer for the current boot only | No | Priority and facility only |
tail -f /var/log/* | Whatever rsyslog wrote to text files | Yes, subject to logrotate | Text pattern matching only |
Text files still matter where applications write their own logs outside systemd, and syslog forwarding remains common for shipping to a central collector. The journal is the fuller record on a systemd host. On mixed fleets the same investigation usually continues inside Windows event logs, which capture equivalent detail in an entirely different format.
Whichever system produced them, logs are one of four telemetry signals an operations team works with, alongside metrics, traces and network flows. Metrics tell you that a node slowed down, and logs tell you what it was doing at the time, so knowing the difference between logs and metrics decides which one you reach for first.
How Do You Read journalctl Logs Without Drowning in Output?
Running the journalctl command with no arguments prints every entry in the journal, oldest first, inside a pager. On a server holding months of history that runs to thousands of screens, so the first flags worth learning are the ones that reduce what you have to read. The complete flag list lives in man journalctl, and the handful below covers most day-to-day work.
Command | What it returns |
journalctl | All entries, oldest first, in the pager |
journalctl -r | All entries, newest first |
journalctl -n 20 | The last 20 entries |
journalctl -e | Opens the pager at the end of the journal |
journalctl --no-pager | Prints straight to standard output |
journalctl -q | Suppresses informational hints and permission warnings |
journalctl -xe | Jumps to the newest entries with explanatory catalog text attached |
The pager is less by default. Press q to quit, / to search forward, G to jump to the last entry. The q key is the answer to how to exit journalctl, which is the first thing that catches almost everyone out.
-x pulls in systemd's catalog text, a short plain-language explanation of what a message means and what to check next, for the entries that have one. Combined with -e it produces journalctl -xe, which is the most useful single command to run in the first minute after a service fails.
Permissions decide how much you see. Root, and members of the systemd-journal, adm or wheel groups, read the whole journal; everyone else reads only messages their own user generated. If output looks suspiciously thin during log monitoring work, check group membership before assuming the entries are gone.
How Do You Run journalctl for a Specific Service?
Running journalctl for a specific service takes one flag: -u, followed by the unit name. The .service suffix is optional and glob patterns work, which helps when you cannot recall the exact unit name.
journalctl -u nginx.service
journalctl -u nginx -u php-fpm
journalctl -u "ssh*"
journalctl --user -u syncthing.service
There are two ways to scope output to a unit, and they behave differently:
-u nginx.service: Returns messages from the unit plus related records such as coredumps and systemd's own start and stop notices
SYSTEMDUNIT=nginx.service: Returns only entries journald attributed directly to processes inside that unit
Use the flag when investigating why a service failed, since the surrounding systemd notices carry the exit code. Use the field when counting application messages, because the extra records skew the total.
For processes that write to syslog rather than running as a unit, filter by the syslog identifier instead. Containers and virtual machines registered with systemd have their own selectors:
journalctl -t sudo
journalctl -t sshd -n 50
journalctl CONTAINER_NAME=payments-api
journalctl -M build-runner
A unit filter on its own rarely settles anything. Combined with the time and priority flags in the next two sections, it becomes the fastest way to isolate a recurring Linux monitoring problem.
How Do You Filter journalctl by Time Range and Boot?
The journalctl since filter accepts both absolute timestamps and plain language relative expressions, and --until closes the window at the other end. Both flags accept exactly the same set of formats.
journalctl --since "2026-09-14 08:00:00" --until "2026-09-14 09:30:00"
journalctl --since "1 hour ago"
journalctl --since -30m -u postgresql
journalctl --since yesterday --until today
journalctl --since "09:00" --until "now" -u nginx
Timestamps are interpreted in the machine's local timezone, which causes quiet confusion when correlating across regions. Add --utc to print entries in UTC, and standardize on it whenever more than one host is involved in the same investigation. When everyone on a call reads the same clock, nobody spends twenty minutes disputing which event happened first, and that saved time is one of the quieter ways teams reduce MTTR.
Boots are the other natural time boundary. When a server rebooted unexpectedly, the interesting entries are the last ones written before the previous boot ended.
journalctl --list-boots
journalctl -b
journalctl -b -1
journalctl -b -1 -p err
-b alone shows the current boot. -b -1 shows the previous one, -b -2 the one before that. Boot offsets shift as new boots accumulate, so quote the boot ID from --list-boots in tickets rather than the offset.
How Do You Tail journalctl Logs in Real Time?
The journalctl tail equivalent is -f, short for follow, which streams new entries as journald writes them. It behaves like tail -f against a text file and accepts every filter described above at the same time.
journalctl -f
journalctl -f -u nginx.service
journalctl -n 100 -f -u postgresql
journalctl -f -u nginx -u php-fpm -p warning
Pairing -n with -f is the pattern most people want when they tail journalctl during a deployment. It prints recent context first, then keeps the stream open, so you are not staring at an empty terminal waiting for something to break.
Follow mode bypasses the pager entirely, so q does nothing. Stop the stream with Ctrl+C.
Live tailing answers what is happening right now on one machine. The observability question is broader: whether the same error is firing on every other node behind the load balancer. Answering that needs the data somewhere other than a terminal window.
How Do You Filter journalctl by Priority and Search Message Text?
journalctl priority filtering uses -p and follows the standard syslog severity scale, where lower numbers indicate greater severity. Passing a single value returns that level plus every more severe level, which means every lower number as well.
Level | Name | Typical meaning |
0 | emerg | System is unusable |
1 | alert | Action required immediately |
2 | crit | Critical failure in a component |
3 | err | Operation failed |
4 | warning | Degraded behavior worth attention |
5 | notice | Normal but significant event |
6 | info | Routine operational message |
7 | debug | Diagnostic detail |
journalctl -p err
journalctl -p 3 -b
journalctl -p warning..err -u nginx
journalctl -k -p err
-k restricts output to kernel messages, giving you dmesg content with journal filtering and cross-boot history attached.
Text search uses -g or --grep, which applies a PCRE pattern to the message field only. Matching is case insensitive when the pattern is all lowercase, and case sensitive as soon as you include a capital letter. Force the behavior with --case-sensitive=yes or no.
journalctl -g "connection refused" -u nginx
journalctl --grep "OOM|out of memory" -b
journalctl -g "authentication failure" --since -24h
That last query is a common starting point for anyone reviewing audit logs after a suspected credential attack, since failed authentication attempts land in the journal well before they reach a security tool.
Which Journal Fields Matter, and How Do You Query Them?
Journal fields are the key-value metadata attached to every entry, and any field can be used as a filter by passing FIELD=value directly to journalctl. This is where the journal earns its place over text files, because the metadata is recorded at write time rather than reconstructed later.
Discover what is available on a given host:
journalctl -N
journalctl -F _SYSTEMD_UNIT
journalctl -o verbose -n 1
-N lists every field name present in the journal, -F lists the distinct values for one field, and -o verbose prints one full entry with all of its fields so you can see what a real record looks like.
The fields worth memorizing:
_PID: Process ID of the sender, useful when one unit forks many workers
_UID: User ID the process ran as
_COMM: Command name, matching what ps reports
_EXE: Full path to the executable
SYSTEMDUNIT: Unit the process belonged to
_TRANSPORT: How the message arrived, such as kernel, syslog, stdout or journal
BOOTID: Boot the entry belongs to
PRIORITY: Severity value from 0 to 7
Fields beginning with an underscore are trusted, meaning journald sets them and a process cannot override them. Fields without the underscore come from the application and can contain anything the developer chose to send.
Combining filters follows three rules:
Different field names combine with AND, so an entry has to match both
The same field name repeated combines with OR
A bare + between two groups turns the whole expression into an OR
journalctl UID=1000 COMM=sshd
journalctl SYSTEMDUNIT=nginx.service + SYSTEMDUNIT=php-fpm.service
journalctl _TRANSPORT=kernel -p err -b
Teams that have already invested in log parsing rules will recognize these fields, because a central collector spends most of its effort recreating exactly this metadata from unstructured text.
How Do You Export journalctl Output for Analysis?
journalctl exports output through the -o flag, and the format you choose decides whether the result is readable by a person or by another program. Redirecting output to a file disables the pager automatically, so no extra flag is needed.
Format | Use it for |
short-iso | Human reading with unambiguous ISO timestamps |
short-precise | Microsecond timestamps during latency investigation |
cat | Message text alone, with no metadata prefix |
verbose | Every field of every entry, for field discovery |
json | One JSON object per line, ready for a parser |
json-pretty | Indented JSON for reading a small number of entries |
export | Lossless binary-safe serialization for transfer |
journalctl -u nginx --since -24h -o short-iso > nginx-day.log
journalctl -u nginx -p err -o json --output-fields=MESSAGE,_PID,PRIORITY
journalctl -u nginx -o json-pretty -n 5
journalctl --since -1h -o export > incident.export
--output-fields trims JSON output to the keys you care about, which matters when piping thousands of entries into a downstream tool. The export format preserves entries exactly as journald stored them, including binary field values, and is the correct choice when handing a journal slice to another team.
For continuous movement rather than one-off extracts, set ForwardToSyslog=yes in journald.conf and let rsyslog handle delivery, or install systemd-journal-upload to push entries over HTTP. Either route feeds the log aggregation layer that makes cross-host queries possible.
What matters at the receiving end is whether the collector preserves the journal's fields. A platform that flattens each entry back into a line of text throws away the metadata that made exporting worthwhile.
How Do You Clear journalctl Logs and Cap Disk Usage?
You clear journalctl logs by rotating the active journal file and then vacuuming the archived files by size, age or count. Start by checking what the journal is consuming before removing anything.
journalctl --disk-usage
sudo journalctl --rotate
sudo journalctl --vacuum-size=500M
sudo journalctl --vacuum-time=2weeks
sudo journalctl --vacuum-files=5
Skipping --rotate is why most attempts to clear journalctl logs appear to do nothing. Vacuuming only removes archived journal files, and the currently active file is never touched, so rotating first turns the active file into an archived one that vacuum can then delete.
Option | Effect |
journalctl --vacuum-size=500M | Deletes oldest archived files until total size falls under the limit |
journalctl --vacuum-time=2weeks | Deletes archived files whose newest entry predates the cutoff |
journalctl --vacuum-files=5 | Keeps only the newest five archived journal files |
Manual cleanup is a fix for a problem better solved in configuration. These directives in /etc/systemd/journald.conf enforce limits continuously:
SystemMaxUse: Total disk the journal may occupy, defaulting to 10 percent of the filesystem and capped at 4G
SystemKeepFree: Free space journald will leave for other uses, defaulting to 15 percent and capped the same way
SystemMaxFileSize: Size of an individual journal file before rotation
SystemMaxFiles: Maximum number of journal files retained
MaxRetentionSec: Age at which entries are removed regardless of size, disabled unless you set it
journald applies whichever of the two size limits is reached first. Align these values with the log retention policies your compliance scope demands, because a default 4G cap on a busy host can roll off evidence in days.
Consider a finance team whose auditor asks for ninety days of authentication records across twelve Linux application servers. Left on defaults, a busy host may hold two weeks of entries before older ones roll off. The rest of the ninety days exists nowhere, and no command run afterwards brings it back, which turns a storage setting into a compliance finding.
Why Do Log Messages Go Missing from the Journal?
Missing entries usually mean journald dropped them on purpose. Rate limiting is applied per service: if a unit produces more messages than RateLimitBurst allows inside the RateLimitIntervalSec window, everything further is discarded until the window resets.
Three details decide whether a message survives:
RateLimitIntervalSec: Length of the counting window, 30 seconds by default
RateLimitBurst: Messages allowed inside that window, 10000 on current systemd and 1000 on older releases
Scope: Counted per service, so one noisy unit never spends another unit's allowance
A service in a crash loop passes either figure in under a second, which is exactly when the output matters most. Take a payments API restarting forty times in a minute: the first few hundred stack traces reach the journal and everything after that is discarded. The postmortem then stalls on a question the logs can no longer answer, and the bill arrives as a second outage.
Working out the allowance before an incident is cheaper than discovering it during one. The diagram maps a single service against its 30 second counter and marks the moment journald stops writing anything down.
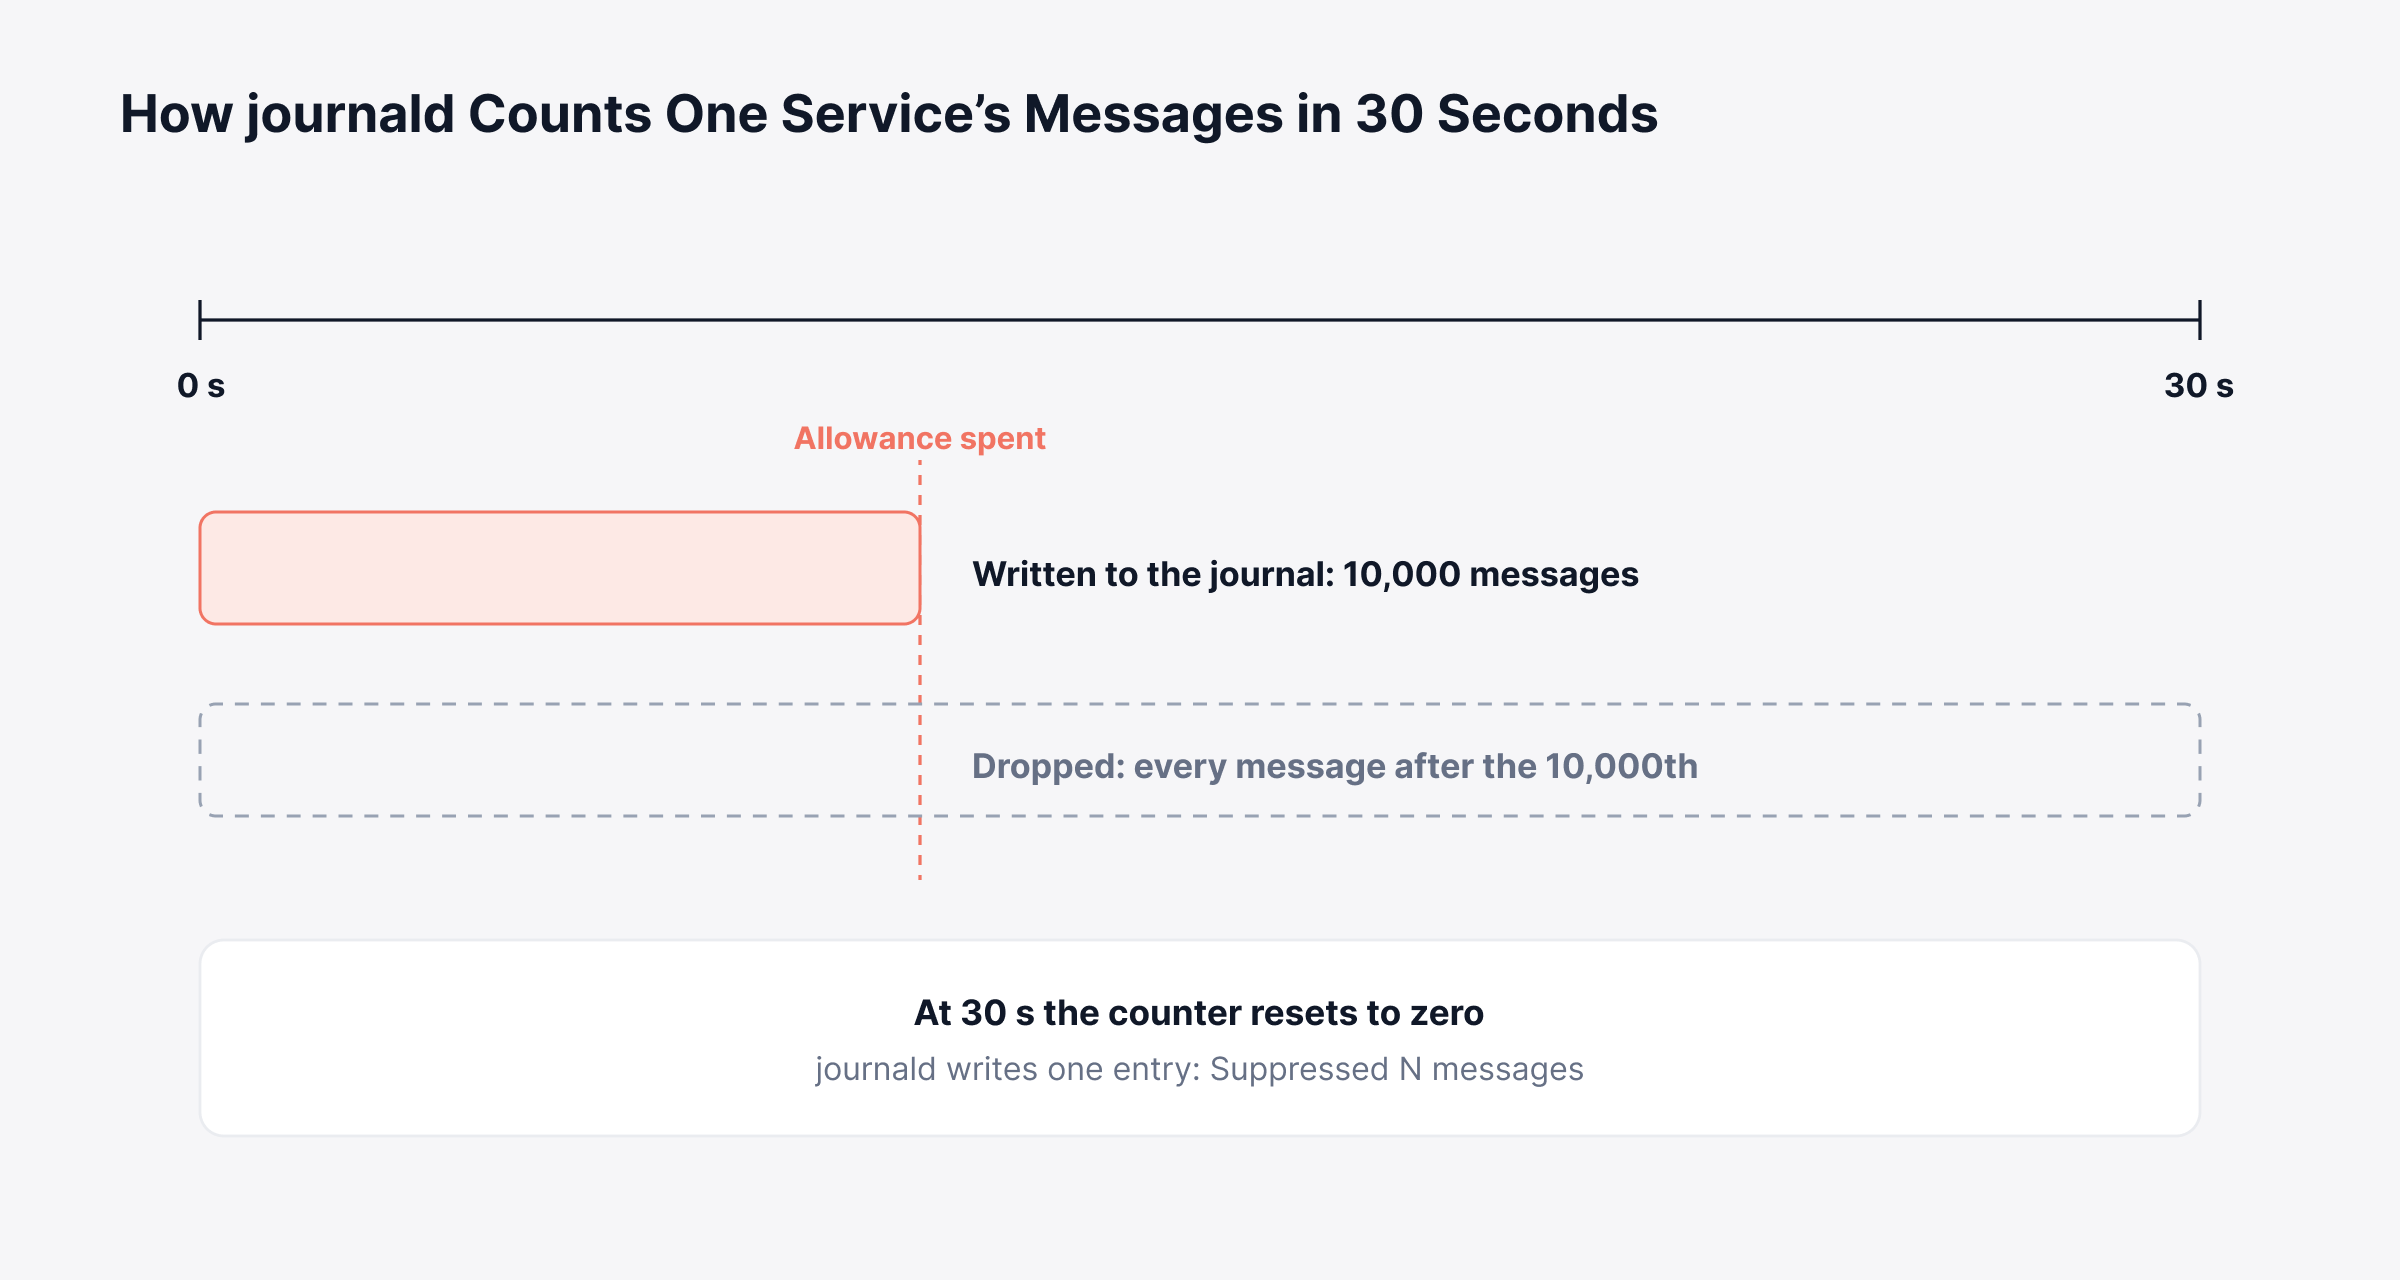
journald writes a note whenever it drops messages, so you can confirm whether it happened:
journalctl --grep "Suppressed" -n 50 --no-pager
Fix it in one of two places. Raise RateLimitBurst and RateLimitIntervalSec globally in journald.conf, or override a single noisy unit with LogRateLimitBurst= and LogRateLimitIntervalSec= in its service file. Setting either value to 0 switches rate limiting off entirely, which is safe only where SystemMaxUse already caps how much disk the journal can take.
Two other causes account for most remaining gaps. Volatile storage discards everything at reboot, and a SystemMaxUse ceiling rotates old entries out sooner than teams expect on high-volume hosts. Both are easier to spot once you categorize logs by source and volume rather than treating the journal as one undifferentiated stream.
How Do You Read Journals from Another Machine or an Offline Disk?
journalctl can read journal files it did not create, which turns it into a forensic tool as well as a live one. Point it at a file, a directory or a mounted root filesystem.
journalctl --file=/var/log/journal/*/system.journal
journalctl --directory=/mnt/recovered/var/log/journal
journalctl --root=/mnt/recovered -u nginx.service
journalctl -m
--root is the option for a recovered disk, because it treats the mounted path as a complete system root and locates the journal directory inside it. -m, or --merge, combines all available journals including those copied in from other hosts, which is how you build a single timeline from several machines.
Two integrity features are worth enabling on any host in audit scope:
journalctl --verify: Checks the internal consistency of journal files and reports corruption
journalctl --setup-keys: Enables Forward Secure Sealing, which cryptographically seals entries at intervals so later tampering becomes detectable
Sealing requires persistent storage and produces a verification key you keep off the machine. It gives an auditor evidence that entries were not edited after they were written. That evidence works alongside the wider log data security controls most regulated environments already run.
Every capability covered so far assumes one operator, one shell and one machine. That assumption is where the command stops scaling.
Where Does journalctl Stop Being Enough at Fleet Scale?
journalctl answers questions about one host. Every command in this reference assumes you already know which machine to log into, and that assumption breaks the moment an incident spans a load balancer, four application servers and a database cluster.
The practical limits show up in the same order every time:
Query scope: One journal per host, so cross-host questions become an SSH loop and a manual merge
Retention: Local disk caps roll entries off long before an audit window closes
Correlation: No way to align journal entries with metrics, traces or network flow data
Alerting: The journal records events and takes no action when a pattern appears
Access: Reading production logs means shell access to production servers
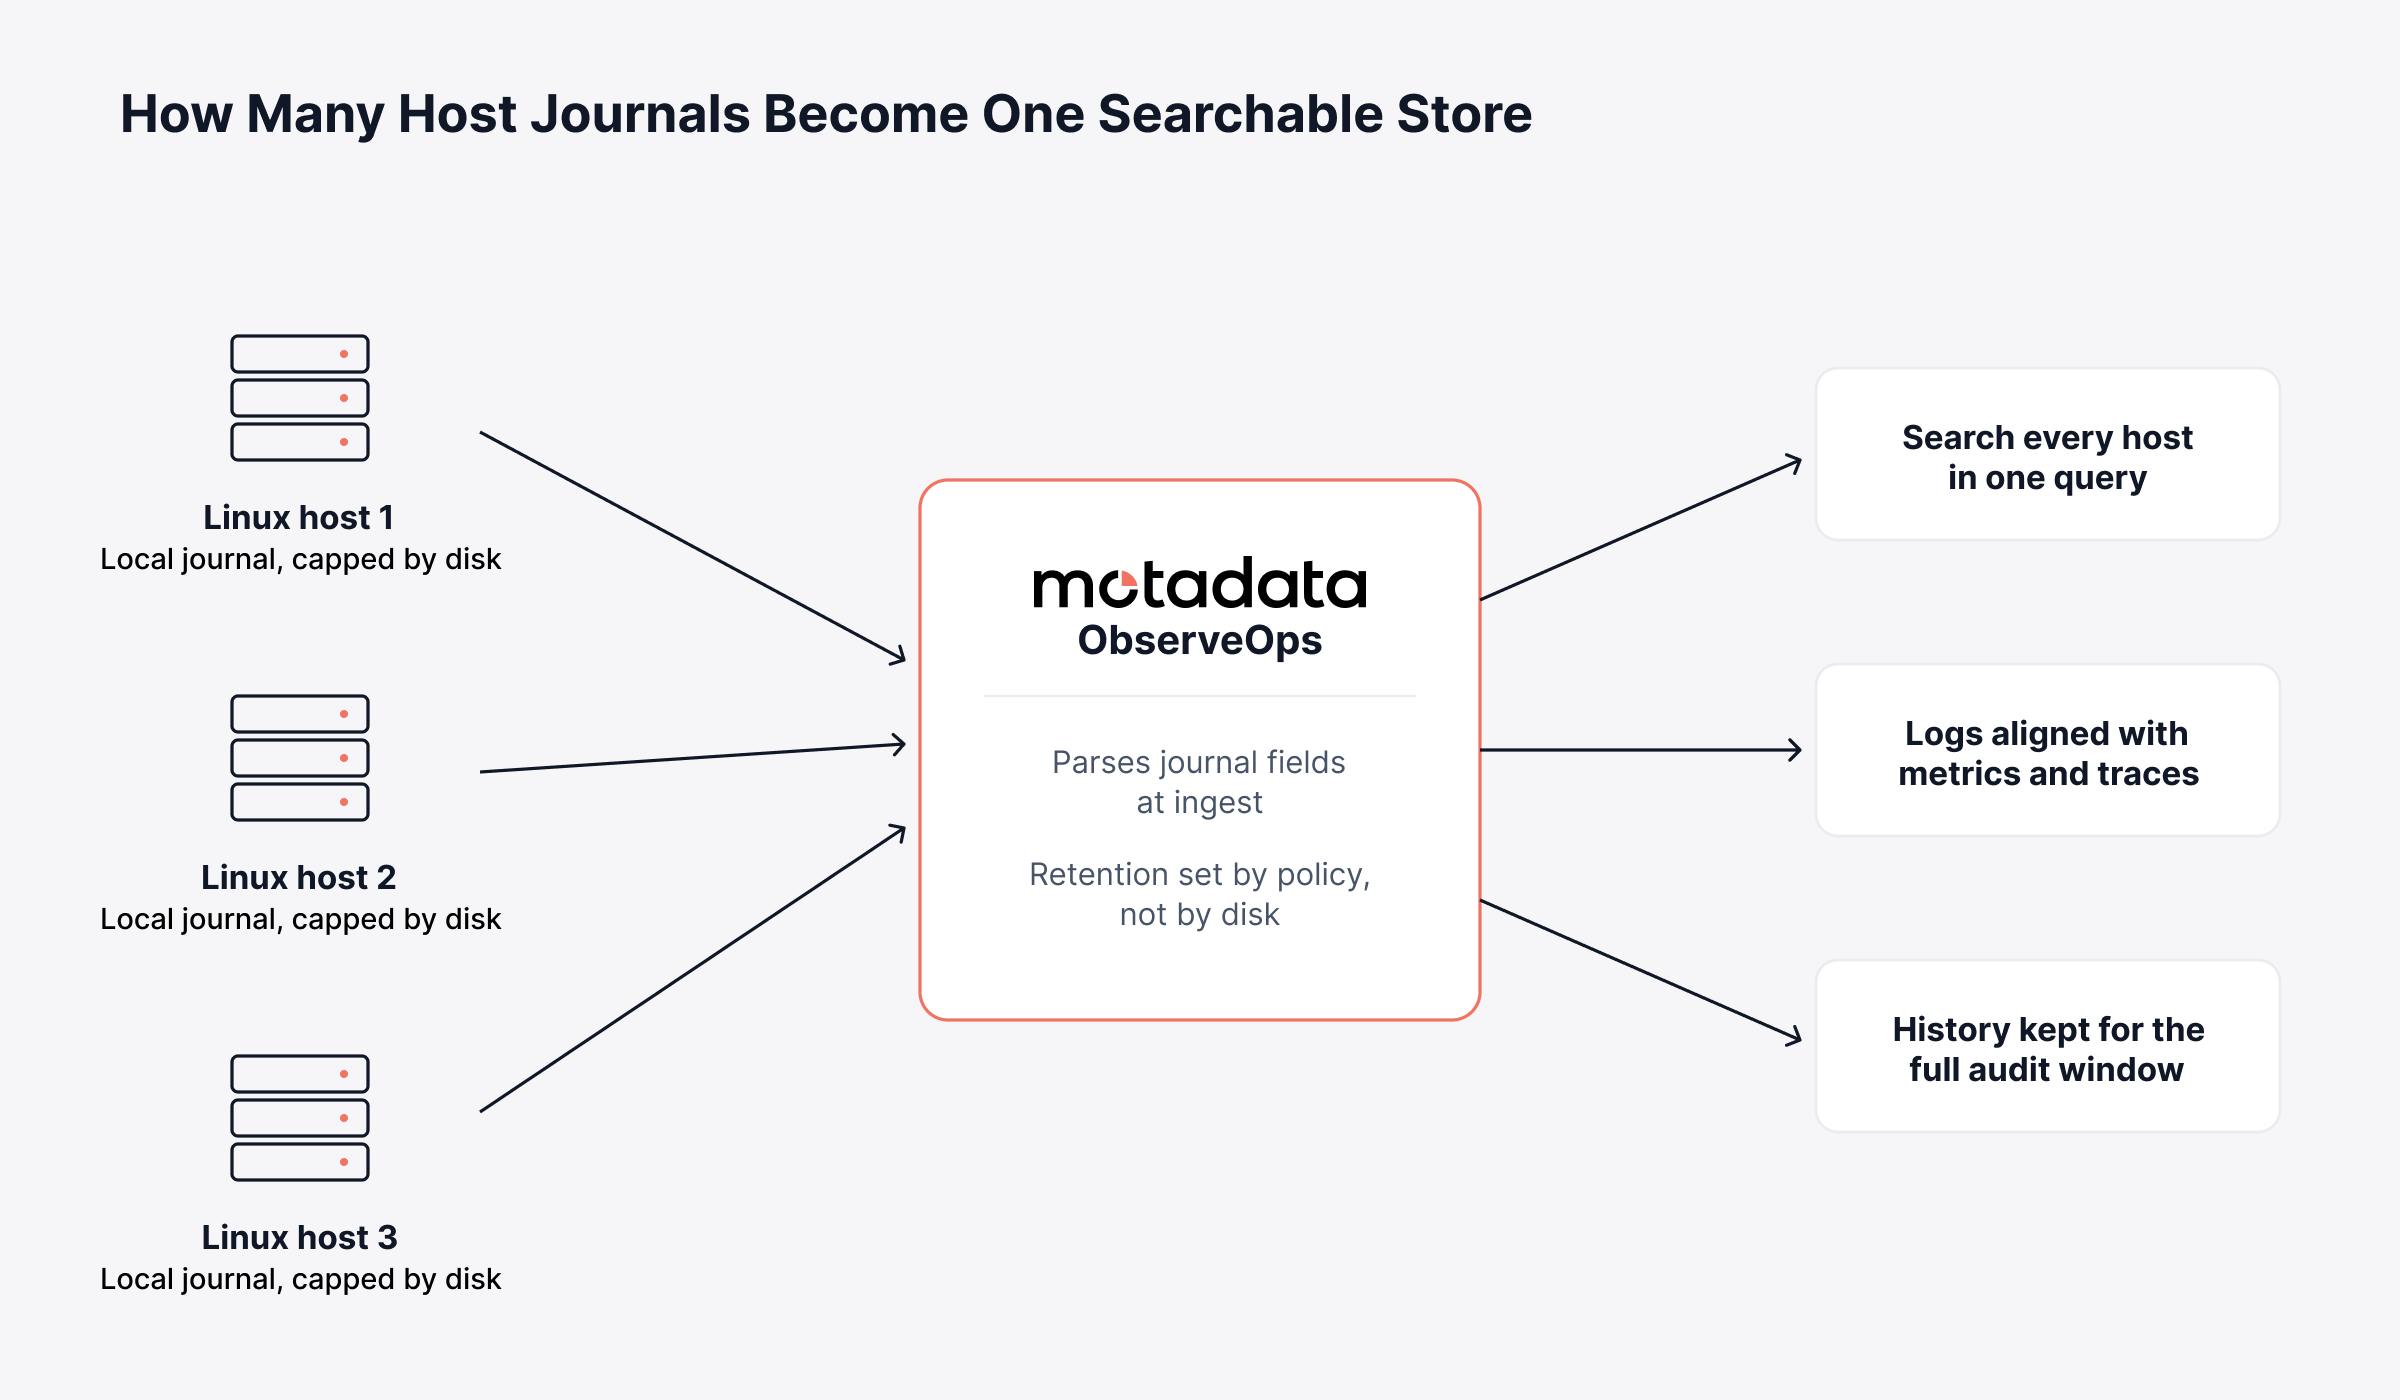
Removing those limits takes a collection layer that lives outside the servers themselves. It reads the journal and syslog output from every Linux host, parses each entry into fields as it arrives, and retains the result under a policy you set rather than one a disk quota decides for you.
What that buys you is reach. A single query then covers every host, and where the same store also holds metrics, flows and traces, an error entry can be placed next to CPU saturation on the same node without exporting anything. That is what centralized logging changes about time-to-answer during an outage, and it is the model Motadata ObserveOps is built on.
The shift is from querying hosts one at a time to querying all of them once. The diagram shows what each server keeps locally, what a collection layer adds, and the three questions that become answerable as a result.
Correlating those signals is a separate skill from collecting them, and log correlation is where most of the investigation time is actually recovered.
Search Every Linux Journal at Once with Motadata ObserveOps
journalctl is the strongest local log interface any operating system ships, and it costs nothing beyond the systemd you already run. Knowing -u, --since, -p, -o json and the vacuum options well will resolve most single-host problems faster than any dashboard. Where it runs out is scale, since the journal holds what one disk allows, answers questions about one machine, and takes no action when a pattern repeats across twenty of them.
Centralizing logs is not free, and it should be said plainly: any platform adds an ingest pipeline to operate, storage to budget for, and parsing rules that need maintenance as applications change. It also never removes the need to know journalctl on the box itself, because the first thing a good engineer does during an outage is still open a shell.
What changes with Motadata ObserveOps is the range of questions you can ask. The query that needed an SSH loop and a manual merge becomes one search, retention stops depending on local disk, and a pattern nobody was watching for becomes an alert.
FAQs
What is journalctl in linux?
journalctl is the command line tool for querying the systemd journal, the structured log store that systemd-journald maintains. It reads binary indexed journal files containing kernel messages, service output and syslog traffic, and supports filtering by unit, time, boot, priority and any metadata field.
How do you exit journalctl?
Press q to quit the pager that journalctl opens by default. If you are following live output with -f there is no pager, so use Ctrl+C to stop the stream instead.
What is the difference between systemctl and journalctl?
systemctl manages systemd units by starting, stopping and inspecting their state, while journalctl queries the log entries those units produced. Running systemctl status shows only the last ten journal lines for a unit, so journalctl is the tool to use once you need the full history.
What is dmesg vs journalctl?
dmesg reads the kernel ring buffer for the current boot only and clears at reboot. journalctl covers kernel messages through journalctl -k plus every other log source on the host, and retains them across boots when persistent storage is enabled. Observability platforms such as Motadata ObserveOps ingest both so kernel errors can be lined up against application behavior across hosts.
How do you clear journalctl logs without losing recent entries?
Run sudo journalctl --rotate first, then sudo journalctl --vacuum-time=2weeks or --vacuum-size=500M to remove older archived files while keeping recent data. Setting SystemMaxUse and MaxRetentionSec in journald.conf enforces the same limits continuously, and forwarding to a platform such as Motadata ObserveOps keeps the longer history off the host entirely.
Author
Poonam Lalani
Content Strategist
Poonam Lalani is a B2B content strategist and writer with a background in computer engineering and experience across enterprise technology domains, including AI, cloud, DevOps, data engineering, and IT operations. She specializes in creating research-driven content that simplifies complex ideas and supports product education, thought leadership, and business growth.