What Is Application Performance Monitoring (APM)? A Complete Guide
Application performance monitoring (APM) is the practice of tracking, measuring, and managing software application performance using specialized tools that collect metrics like response time, error rates, and resource utilization to ensure applications meet user expectations and business requirements.
A customer clicks "Place Order" and nothing happens. They click again. Still nothing. After 12 seconds, they close the tab and buy from your competitor instead. Your server logs show 200 OK -- no errors. But the application was slow enough to lose the sale, and nobody on your team knew until the revenue report came in.
That's the problem APM solves. It doesn't just tell you whether your application is up -- it tells you whether it's actually working well for the people using it.
What Is Application Performance Monitoring (APM)?
Application performance monitoring is the process of monitoring, measuring, and managing how a software application performs in production. APM tools collect data on key performance indicators -- response time, CPU and memory consumption, error rates, network latency, and transaction throughput -- and present it in a way that lets your team act fast.
Think of APM as the difference between knowing your application is running and knowing it's running well. It gives you a live view of how every component within your app is behaving, how the application's architecture is holding up under load, and where problems are forming.
APM tools help IT teams:
Track performance across all application tiers (frontend, backend, database, APIs)
Identify bottlenecks before they affect end users
Correlate infrastructure metrics with user experience data
Meet availability, response time, and reliability targets
Reduce the business impact of poor application performance
Whether your applications are monolithic, microservices-based, or running in containers across multiple clouds, APM gives you the visibility you need to keep them performing at the level your users expect.
Why APM Matters for Your Business
Application performance isn't just an IT concern -- it's a business concern. Here's why:
User experience drives revenue. Users expect applications to be fast and functional. If your app is slow or error-prone, users abandon transactions. That directly hits your bottom line. Studies consistently show that even a one-second delay in page load time can reduce conversions by 7%.
Downtime is expensive. When applications fail, the costs go beyond lost sales. There's the engineering time spent diagnosing the issue, the customer support tickets, the damage to your brand reputation, and potential SLA penalties.
Proactive beats reactive. APM shifts your team from firefighting to prevention. Instead of waiting for users to report problems, you catch performance degradation in real time and fix it before anyone notices.
Shared metrics eliminate finger-pointing. When development, operations, and business teams all see the same performance data, the conversation shifts from blame to resolution. Everyone can see what's causing the problem, so they can focus on fixing it.
Performance data informs strategy. APM metrics help you make informed decisions about infrastructure investments, code optimization, and capacity planning. You're working from data, not guesswork.
How Application Performance Monitoring Works
APM works by continuously collecting performance data from every layer of your application stack and analyzing it to surface problems. Here's the process:
1. Data Collection. APM agents or instrumentation code deployed across your application collect metrics from servers, databases, network devices, APIs, and user sessions. This data includes response times, error rates, CPU utilization, memory consumption, and transaction traces.
2. Aggregation and Correlation. The collected data is aggregated into a central platform where it's correlated across components. This lets you trace a slow user experience back to a specific database query, API call, or code path.
3. Real-Time Analysis. APM tools analyze performance data against predefined thresholds and baselines. When a metric exceeds its threshold or deviates from its baseline, the system generates an alert.
4. Alerting and Notification. Alerts reach the right team members through their preferred channels -- email, Slack, PagerDuty, or your ITSM platform. Good APM tools let you configure alert routing so the right people get the right alerts.
5. Root Cause Analysis. When an issue is detected, APM tools provide drill-down capabilities through root cause analysis that trace the problem from the user experience down to the specific component, service, or line of code causing it.
6. Optimization. Over time, APM data reveals patterns -- recurring bottlenecks, capacity constraints, code inefficiencies -- that your team can address proactively through optimization and architecture improvements.
Five Core Elements of APM
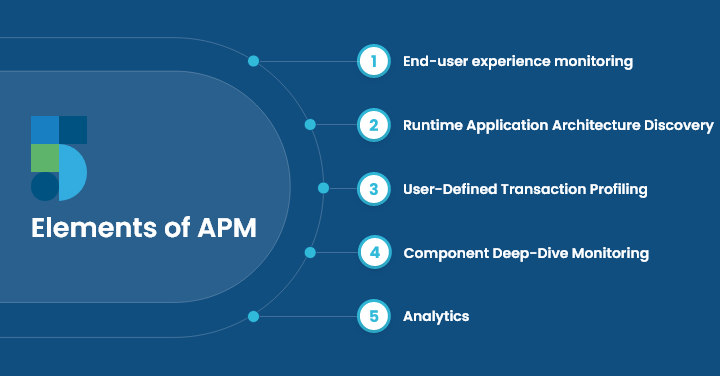
Effective APM platforms address five interconnected areas:
1. End-User Experience Monitoring. This is the most important element. It captures how end users actually experience your application -- page load times, transaction completion rates, errors encountered, and interaction responsiveness. Everything else in APM exists to explain and improve this metric.
2. Runtime Application Architecture Discovery. Your application's architecture isn't static. Components spin up and down, dependencies change, and new services get deployed. This element automatically maps your application's architecture during runtime, identifying dependencies and potential bottleneck points as they emerge.
3. User-Defined Transaction Profiling. Individual user transactions traverse multiple components and services. Transaction profiling tracks these paths end-to-end, showing you exactly where time is being spent and where delays occur. This is especially important for microservices architectures where a single request might hit dozens of services.
4. Component Deep-Dive Monitoring. When you've identified which component is causing problems, you need detailed performance data for that specific component -- whether it's a database, application server, third-party integration, or message queue. Deep-dive monitoring provides that granular visibility.
5. Analytics and Reporting. Raw performance data isn't useful until you can identify trends, patterns, and correlations. Analytics turns APM data into actionable insights that help you make informed decisions about optimization priorities and resource allocation.
Key APM Metrics to Track
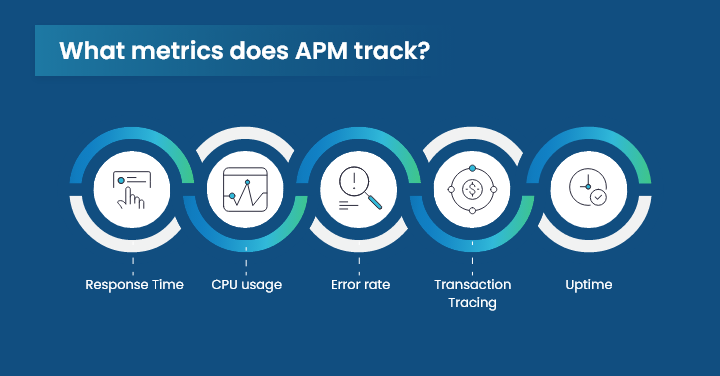
Here are the metrics that matter most for application performance monitoring:
Metric | What It Measures | Why It Matters |
|---|---|---|
Response Time | Time from user request to application response | The metric users feel most directly; high response time drives abandonment |
Error Rate | Percentage of failed requests or transactions | Rising error rates signal code bugs, infrastructure issues, or capacity problems |
CPU Utilization | Processor consumption by the application | Sustained high CPU indicates bottlenecks or the need to scale |
Memory Usage | RAM consumption patterns | Memory leaks cause gradual performance degradation and eventual crashes |
Transaction Throughput | Number of transactions processed per second | Shows capacity utilization and helps with scaling decisions |
Uptime / Availability | Percentage of time the application is operational | Directly tied to SLA commitments |
Database Query Time | Time spent executing database operations | Slow queries are one of the most common causes of application slowdowns |
API Latency | Response time for internal and external API calls | API performance affects every service that depends on it |
Set performance baselines using historical data, define thresholds that trigger alerts, and monitor these metrics continuously. When a metric crosses its threshold, your team should know about it immediately -- through real-user monitoring data and automated alerts.
Benefits of APM for IT and DevOps Teams
1. Faster Issue Resolution
APM tools pinpoint the exact source of performance problems, reducing mean time to resolution (MTTR). Instead of spending hours correlating logs across systems, your team can trace issues to root cause in minutes.
2. Better User Experience
By monitoring application performance from the user's perspective, teams can identify and fix issues before they impact satisfaction. This includes catching slow page loads, failed transactions, and error states that users encounter.
3. Improved Operational Efficiency
APM automates the detection and diagnosis of performance problems, reducing the manual effort your team spends on troubleshooting. That frees up engineering time for feature development and innovation.
4. Reduced Costs
Catching performance issues early prevents costly emergency fixes, reduces the need for over-provisioned infrastructure, and minimizes revenue loss from downtime and poor performance.
5. Data-Driven Capacity Planning
APM metrics reveal usage patterns and growth trends that help you plan infrastructure capacity. You can scale proactively instead of reactively, avoiding both over-spending and performance crises.
6. AI-Powered Insights
Modern APM platforms use machine learning to detect anomalies, predict issues before they occur, and automatically correlate events across your application stack. AI assistance helps teams prioritize alerts based on business impact rather than raw severity.
7. Cross-Team Collaboration
APM provides a shared view of application performance that development, operations, and business teams can all use. This unified view breaks down silos and enables faster, more effective problem-solving.
APM Use Cases Across IT Environments
Web Applications. Track page load times, server response times, and transaction throughput to ensure fast, responsive web experiences. APM helps you identify whether slowdowns originate in the frontend, backend, database, or network layer.
Mobile Applications. Monitor app launch times, network latency, API performance, and crash rates across iOS and Android devices. APM ensures consistent performance regardless of device type or network conditions.
Cloud Applications. Get visibility into cloud-based resources -- VMs, containers, serverless functions, and managed services. APM helps you optimize performance and cost across AWS, Azure, and GCP environments.
Microservices Architectures. Distributed tracing capabilities let you follow requests across dozens of microservices, identifying exactly where bottlenecks occur at the service level.
Enterprise Applications. Monitor ERP, CRM, and business intelligence platforms to ensure these mission-critical systems meet performance SLAs and support daily business operations without interruption.
APM Best Practices for 2026
Start with user-facing metrics. Begin your APM implementation by monitoring what users experience. Response time, error rate, and availability should be your first dashboards. Infrastructure metrics come second.
Instrument everything, alert selectively. Collect data broadly but configure alerts narrowly. Too many alerts create noise; too few create blind spots. Focus alerts on metrics that indicate real user impact.
Integrate APM into your CI/CD pipeline. Run performance tests as part of your deployment process. Catch regressions before they reach production, not after users report them.
Set baselines, not just thresholds. Static thresholds miss gradual degradation. Use dynamic baselines that adapt to normal patterns so you catch slow-burn problems early.
Correlate APM with business metrics. Connect application performance data to business outcomes -- conversion rates, revenue, cart abandonment. This makes it easier to prioritize fixes based on business impact.
Review and refine regularly. Applications change constantly. Review your APM configuration quarterly to ensure you're monitoring the right things and your thresholds still make sense.
How Motadata Delivers APM
When an application loads slowly or keeps throwing errors, users don't wait -- they leave. And every user who leaves is revenue your business won't recover. That's why investing in the right APM tool matters.
Motadata's application performance monitoring solution gives you end-to-end visibility into every layer of your application stack. From frontend user experience to backend database queries, you can trace performance issues to their root cause and fix them fast.
With Motadata APM, your team gets:
Real-time performance dashboards that show application health at a glance
AI-driven anomaly detection that catches issues before users notice them
Distributed transaction tracing across microservices and cloud environments
Automated root cause analysis that reduces MTTR from hours to minutes
Integration with ITSM workflows for incident management and resolution tracking
FAQs
How does APM impact user experience?
APM gives your team full visibility into application components, helping identify errors and performance issues that cause downtime. By catching and fixing problems early, you reduce the errors users encounter, which directly improves satisfaction and reduces support costs.
How does APM detect and diagnose errors?
APM uses a combination of real-time metrics collection, transaction tracing, and anomaly detection. It monitors performance indicators across your application stack, identifies unusual patterns, and traces issues to their root cause -- whether that's a slow database query, a failing API, or a resource constraint.
How does APM integrate with CI/CD?
APM tools integrate into CI/CD pipelines by running automated performance tests during build and deployment stages. This lets teams catch performance regressions during development rather than after they reach production, keeping applications fast and reliable through continuous delivery cycles.
What is the role of APM in DevOps?
APM provides DevOps teams with real-time application performance insights, faster issue detection through automated monitoring, and shared dashboards that support collaboration between development and operations teams for continuous improvement.
What are the five elements of APM?
The five core elements are: end-user experience monitoring, runtime application architecture discovery, user-defined transaction profiling, component deep-dive monitoring, and analytics/reporting. Together, they provide complete visibility into how applications perform and why.
Author
Motadata Team
Content Team
Articles produced collaboratively by our engineering and editorial teams bear the collective authorship of Motadata Team.


