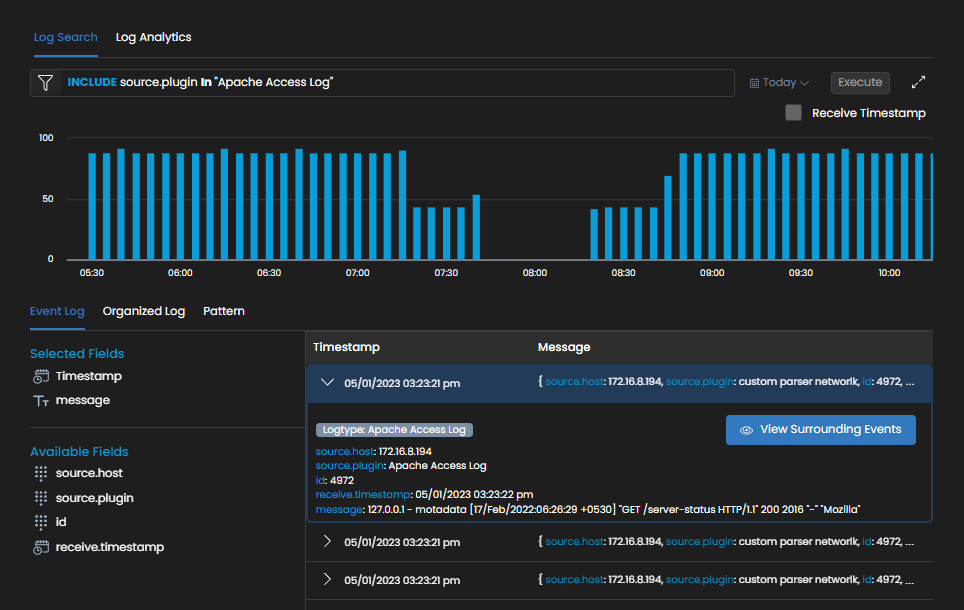
Apache web servers are widely adopted among IT enterprises while hosting their websites and web applications for the sheer range of capabilities and features they provide.
The logs collected from Apache servers contain records of all the activity information and performance status and requests – the requests sent from computers, the processed requests, responses sent by the Apache server to the hosts, and the internal actions.
An Apache Log Monitoring tool helps you gain complete visibility into Apache web server performances and lets you track critical metrics.
This makes you one step ahead of the issues and bottlenecks affecting your web servers. Log Analysis by Motadata also offers an Apache Log Management solution that helps collect, process, index, and correlate Apache server logs.
Access & Error Apache Logs
Apache servers generate two types of logs, access logs and error logs. The Apache stores both access and error log data in separate files on the server.
While the access log contains information on incoming requests into the web server, the error log contains information about the web server encounters when processing the requests.
Access logs also include the data of visited pages, the success status of requests, and the response time. The error logs include the diagnostic information about the server itself.
Log Parsing & Analysis
Motadata also offers an advanced and powerful log parser that extracts all the key fields from the log data, such as client and server IP address, date, time, server name, port name, client-server Unique Resource Identifier (URI) query, etc.
Once the log data is parsed with the help of a parser and presented in the report and dashboard format, you can set up the alerts based on the specified log field.
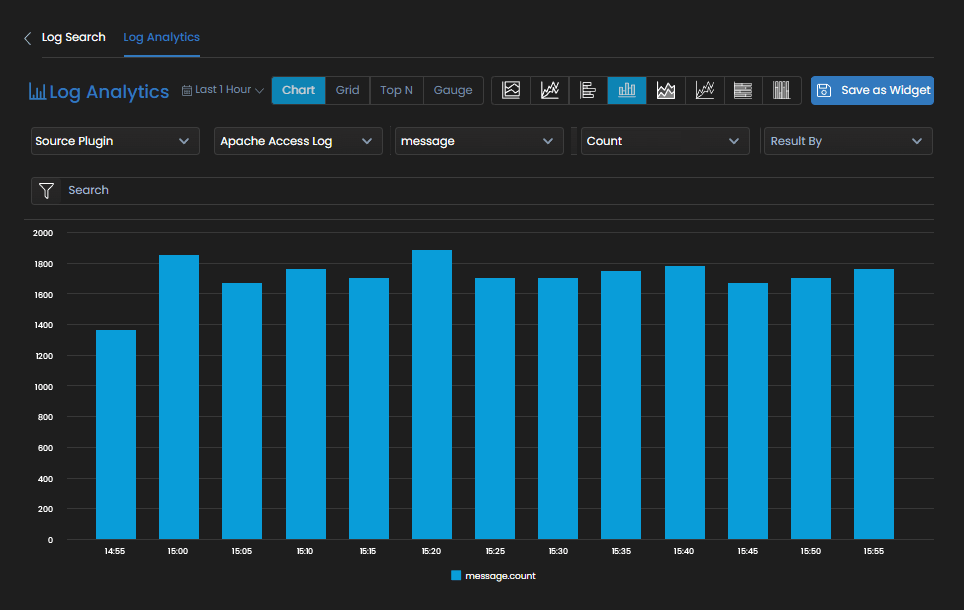
The analytical capabilities let you perform in-depth Apache server log analysis and derive your Apache web server’s trends and usage patterns.
The predefined algorithms help you understand the events and errors of your Apache web server. In addition, it also gives you complete visibility into re-flag events such as unsupported media types, HTTP bad requests, too-large URIs, etc. This visibility helps you discover issues with Apache server performance and security.
The dashboards also help you with top visitors, URLs accessed, status codes, used browsers, etc.
Log Auditing & Reports
As the apache access logs have vital information on client IP addresses, HTTP requests, and timestamps, it is pretty crucial to audit Apache access logs.
In addition, you can track malicious user activity and prevent security breaches by keeping tabs on the inbound requests to the Apache web servers.
The Apache web server reports help you discover the most frequently occurring errors on the Apache server. In addition, you can also identify the most popular pages on your website and get complete insights into the user experience.
By investigating the occurrences of any particular issue, you can identify the cause, resolve them and prevent them from maintenance.
Real-time Log Monitoring
Motadata AIOps also lets you get the live tails of the log data in the form of such information that can be helpful for network admins. Filter out the events based on the activities and strings and highlight the live tails received from Apache servers.
You can monitor the changes of multiple log sources at once, and the filtering ability lets you focus on what matters the most and saves you from drowning in an overload of data with Server Log Management.
Better Security with Motadata AIOps
Monitoring access and error logs help you enhance the security of your Apache servers and also of your entire network architecture.
For example, you can detect the number of login attempts and failed attempts during a specific time. In addition, pattern identification from the logs and brute force attack identification help you get a secured network.
Display the widgets from the log data and track the log behaviors and KPIs. Apache log management tool helps you analyze logs and decide their importance based on their impact on the server activities.
It makes your network cost-effective and scalable and provides complete visibility into your Apache server as well as your network infrastructure.


