AWS Monitoring Best Practices: A Practitioner's Guide to Performance, Security, and Cost
AWS monitoring is the continuous process of collecting, analyzing, and acting on performance data from Amazon Web Services resources — including compute, storage, networking, and application layers — to maintain reliability, security, and cost efficiency across your cloud environment.
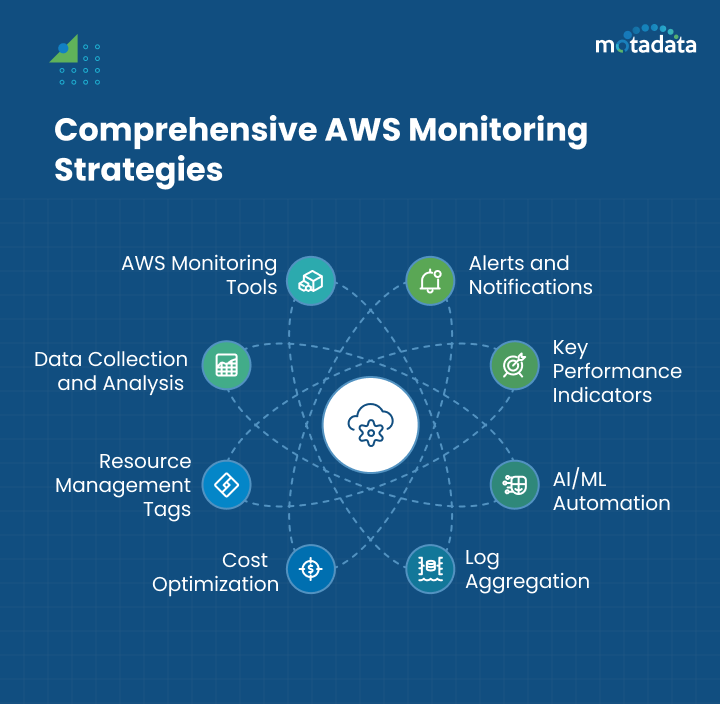
With 94% of enterprises running workloads on cloud services, AWS environments have become the backbone of modern infrastructure. But cloud doesn't mean carefree. Without a solid monitoring strategy, hidden inefficiencies pile up, security gaps go unnoticed, and costs creep higher every month. Proactive monitoring isn't just a best practice — it's what separates teams that react to incidents from teams that prevent them. This guide walks through 8 AWS monitoring best practices that cover performance, security, and cost optimization.
What Is AWS Monitoring?
AWS monitoring gives you a detailed view of how your Amazon Web Services resources perform. The process helps you find problems before they grow, make sure resources are used efficiently, and keep services running. Tracking metrics like CPU utilization, memory usage, latency, and error rates is the foundation of a healthy AWS infrastructure.
But monitoring isn't just about collecting data — it's about turning that data into actionable insights that help your team make faster, better decisions.
Why AWS Monitoring Is Critical for Cloud Operations
Without proper monitoring, organizations face performance degradation, security blind spots, and runaway costs. Active monitoring helps teams detect unusual activity and problems early, giving them the time to respond before users are affected.
Strong AWS monitoring leads to:
Better application performance through early issue detection and capacity planning.
Smarter resource usage by identifying underutilized or over-provisioned instances.
Stronger security through real-time threat detection and audit trail visibility.
Lower costs by eliminating waste and right-sizing resources based on actual usage data.
8 AWS Monitoring Best Practices for Performance, Security, and Cost
1. Setting Up Alerts and Notifications
Timely alerts are the backbone of any monitoring strategy. They give your team immediate visibility into potential problems and prevent minor issues from becoming major outages.
Configure your monitoring tools to trigger alerts when specific thresholds are crossed — CPU spikes, low disk space, elevated error rates, or unusual network traffic patterns. Customize notification channels based on severity: email for informational alerts, SMS or PagerDuty for critical incidents that need immediate response.
Best practices for alerting:
Set different severity levels (info, warning, critical) with appropriate escalation paths.
Use correlation rules to group related alerts and reduce noise.
Route alerts to the team that owns the affected service, not a generic inbox.
Review and tune alert thresholds monthly to prevent alert fatigue.
2. Defining Key Performance Indicators (KPIs)
KPIs connect your monitoring data to business outcomes. They help you understand not just how AWS resources are performing, but whether that performance supports your application and user experience goals.
Essential AWS KPIs to track:
KPI | AWS Service | Why It Matters |
|---|---|---|
CPU Utilization | EC2 | Indicates compute capacity and right-sizing needs |
Request Latency (p99) | ALB/API Gateway | Directly affects user experience |
Error Rate (4xx/5xx) | CloudFront/ALB | Signals application or configuration issues |
Memory Utilization | EC2 (custom metric) | Prevents OOM crashes and performance degradation |
Disk I/O | EBS | Impacts database and application performance |
Network Throughput | VPC | Identifies bandwidth constraints |
API Call Volume | CloudTrail | Security auditing and usage tracking |
Map these KPIs to SLA commitments and business goals. If your SLA promises 99.95% uptime, your KPIs should track every metric that could threaten that target.
3. Automating Monitoring with AI and ML
Manual monitoring doesn't scale when your AWS environment generates millions of data points per hour. AI and machine learning add predictive analysis and anomaly detection that catch problems human operators would miss.
AI and ML can:
Analyze historical data to establish performance baselines and detect deviations automatically.
Predict capacity issues before they affect application performance.
Correlate events across services to speed up root cause analysis.
Reduce alert fatigue by distinguishing genuine anomalies from normal variance.
You can use AWS-native services like Amazon DevOps Guru for automated anomaly detection, or pair CloudWatch with third-party AI-powered monitoring platforms for broader coverage. AWS Lambda functions can automate responses to specific conditions — scaling resources, restarting services, or triggering incident workflows.
When you apply AI and ML to monitoring, your team can handle larger and more complex environments while spending less time on manual alert triage and more time on strategic improvements.
4. Log Aggregation and Anomaly Detection
Log data from AWS services contains essential information about system behavior and potential issues. Centralizing that data is key to effective monitoring.
Bring together logs from CloudTrail, VPC Flow Logs, application logs, and Lambda function logs into a single analysis platform. This unified view helps you:
Detect unauthorized access attempts by analyzing login patterns and API call anomalies.
Trace request flows across microservices to identify bottlenecks.
Meet compliance requirements by maintaining searchable audit trails.
Identify configuration drift by monitoring infrastructure change logs.
You can use AWS CloudWatch Logs for native log management, or third-party platforms that offer advanced parsing, pattern detection, and cross-service correlation.
5. Optimizing Monitoring Costs Without Losing Visibility
Comprehensive monitoring is essential, but it shouldn't drain your cloud budget. An effective strategy balances coverage with cost efficiency.
Data tiering strategy:
Data Type | Storage Tier | Retention | Cost Impact |
|---|---|---|---|
Real-time metrics | Hot storage | 7-30 days | Highest |
Historical metrics and logs | Warm storage | 90-180 days | Moderate |
Compliance and audit logs | Cold storage | 1-7 years | Lower |
Archived data | Glacier/archive | 7+ years | Lowest |
Cost optimization tactics:
Audit your metrics regularly and remove metrics nobody's looking at.
Use sampling for high-volume, low-priority metrics.
Set up lifecycle policies to automatically move aging data to cheaper storage tiers.
Right-size your monitoring agents and collectors — they consume compute resources too.
Use AWS Cost Explorer to track monitoring-related spending as a separate cost category.
6. Using Tags for Resource Management and Monitoring
As your AWS environment grows, a consistent tagging strategy becomes essential for managing resources effectively. Tags add context to your monitoring data and make it possible to filter, group, and analyze resources by business function, environment, owner, or cost center.
Implement a tagging policy that covers:
Environment (production, staging, development)
Owner (team or individual responsible)
Application (which app or service the resource supports)
Cost center (for financial tracking and chargeback)
When you integrate tagging with your monitoring strategy, you can quickly isolate performance issues to a specific application or environment, track costs by team, and apply security policies based on resource classification.
7. Collecting and Analyzing Data Across Your AWS Environment
Modern applications span multiple AWS services, generating data from dozens of sources. Don't limit your monitoring to a few obvious metrics — cast a wider net.
Data sources to include:
CloudTrail for API activity and security auditing.
VPC Flow Logs for network traffic analysis.
Custom application logs for business logic and error tracking.
RDS Performance Insights for database query analysis.
ECS/EKS metrics for container workload visibility.
S3 access logs for storage usage and access patterns.
A centralized monitoring dashboard helps you visualize this data in one place, making it easier to spot correlations and patterns that individual service consoles miss.
8. Choosing the Right AWS Monitoring Tools
No single tool covers every AWS monitoring need. The best approach combines AWS-native services with third-party platforms that fill the gaps.
AWS-native tools:
Amazon CloudWatch — Metrics, logs, alarms, and dashboards for AWS services.
AWS CloudTrail — API call history and security auditing.
Amazon DevOps Guru — ML-powered anomaly detection.
AWS X-Ray — Distributed tracing for microservices.
What to look for in third-party tools:
Unified dashboards that combine AWS metrics with on-premises and multi-cloud data.
AI-powered anomaly detection and predictive analytics.
Real-user monitoring and synthetic monitoring capabilities.
Automated incident workflows and ITSM integration.
Cost-effective data retention and tiered storage options.
Build a monitoring toolkit that matches your team's skill set, budget, and operational requirements — and review it quarterly as your environment evolves.
Why Motadata for AWS Monitoring
Motadata's AI-native AIOps platform extends your AWS monitoring with unified observability across cloud and on-premises infrastructure. It combines real-time metric collection, AI-powered anomaly detection, and predictive analytics in a single platform — giving your team complete visibility without tool sprawl. Motadata integrates with AWS CloudWatch, CloudTrail, and custom application metrics while adding intelligent alerting, automated root cause analysis, and ServiceOps integration for incident workflows. Start a free trial to see how Motadata strengthens your AWS monitoring strategy.
FAQs
What is AWS monitoring?
AWS monitoring is the continuous process of collecting and analyzing data from AWS resources and applications to understand health, security, and performance. It involves tracking key metrics, logs, and events to find and fix problems before they affect users.
Which AWS services are commonly used for monitoring?
Amazon CloudWatch tracks metrics and logs, AWS CloudTrail records API call history, Amazon DevOps Guru provides ML-powered anomaly detection, AWS X-Ray handles distributed tracing, and AWS Lambda enables custom monitoring automation.
How can I set up monitoring alarms in AWS?
Use the AWS Management Console or AWS SDKs to create CloudWatch Alarms. Select the metric you want to monitor, define the threshold and evaluation period, and configure notification actions through Amazon SNS to alert the right team.
How can I optimize performance through AWS monitoring?
Analyze data from AWS resources — CPU utilization, memory usage, EBS volumes, and network traffic — to identify bottlenecks. Right-size instances, optimize database queries, and use auto-scaling policies based on monitored demand patterns.
What's the difference between AWS CloudWatch and CloudTrail?
CloudWatch monitors resource performance — metrics, logs, and events from your applications and AWS services. CloudTrail tracks API calls made in your AWS account, serving as a security audit and compliance record. They're complementary tools that cover different monitoring dimensions.
Author
Arpit Sharma
Senior Content Marketer
Arpit Sharma is a Senior Content Marketer at Motadata with over 8 years of experience in content writing. Specializing in telecom, fintech, AIOps, and ServiceOps, Arpit crafts insightful and engaging content that resonates with industry professionals. Beyond his professional expertise, he is an avid reader, enjoys running, and loves exploring new places.

")
