Hybrid Cloud Architecture: Components, Models and How to Monitor It
Why does an application that runs well in the data center slow down once one of its tiers moves to AWS or Azure? Often the servers are healthy and the cloud console shows no faults; the delay lives in the connection between them, where neither view reaches.
That blind spot shows up in familiar ways:
A VPN tunnel that flaps overnight and takes the order sync with it
A cloud bill with data transfer charges no one planned for
An outage bridge where the network, server and cloud owners each see a healthy console
So these are design problems before they are operational ones. The way on-premises systems and cloud services are joined decides where data travels and what that costs; it also decides what operations staff can see when something breaks.
Good design starts with knowing the parts and the trade-offs between the main cloud deployment models. In this blog, you will see:
What hybrid cloud architecture is, and how it differs from multi-cloud
The six core components and what to watch in each one
The main architecture models and hybrid cloud deployment patterns
A simple framework for deciding where each workload runs
Design best practices and a six-step observability workflow
What Is Hybrid Cloud Architecture?
Hybrid cloud architecture is the design that connects on-premises infrastructure, private cloud and public cloud services into one operating environment. Workloads and data move between them, and one set of network, identity and management controls covers all of them.
People who ask what is hybrid cloud usually want to know where workloads run. Hybrid cloud architecture answers the next question, how those places are wired together, and the wiring is what separates it from a set of unrelated systems. Three traits mark a true hybrid architecture:
Shared network: Private links or VPN tunnels that carry application traffic between sites and cloud regions
Shared identity: One directory and one access policy for on-premises and cloud resources
Shared management: Common provisioning, security and observability tooling across every environment
Adoption is already broad. Gartner predicts that 90% of organizations will adopt a hybrid cloud approach through 2027. For most IT leaders, the open question is how to run hybrid well across data centers and cloud infrastructure at the same time.
What Are the Four Types of Cloud Architecture?
The four types of cloud architecture are public cloud, private cloud, hybrid cloud and multi-cloud. Some frameworks list community cloud in the fourth slot instead; it describes infrastructure shared by organizations with common rules, such as government agencies.
Type | Who runs the infrastructure | Typical fit | Main trade-off |
Public cloud | A provider such as AWS, Microsoft Azure or Google Cloud, shared across many customers | New applications, spiky or fast-growing demand | Costs climb at scale; less control over data location |
Private cloud | The organization or a hosting partner, for one tenant only | Regulated data, steady workloads, low-latency systems | Capacity has to be bought ahead of demand |
Hybrid cloud | Both of the above, connected and managed together | Portfolios that mix legacy and new applications | More network paths and tools to operate |
Multi-cloud | Two or more public providers | Specific services from each provider; spreading provider risk | Separate consoles, skills and billing models |
Hybrid and multi-cloud often overlap. An enterprise with workloads in its own data center and in two public clouds runs a hybrid multicloud environment, and each added provider brings another console to watch. That makes unified observability a design requirement from the start.
What Are the Core Components of Hybrid Cloud Architecture?
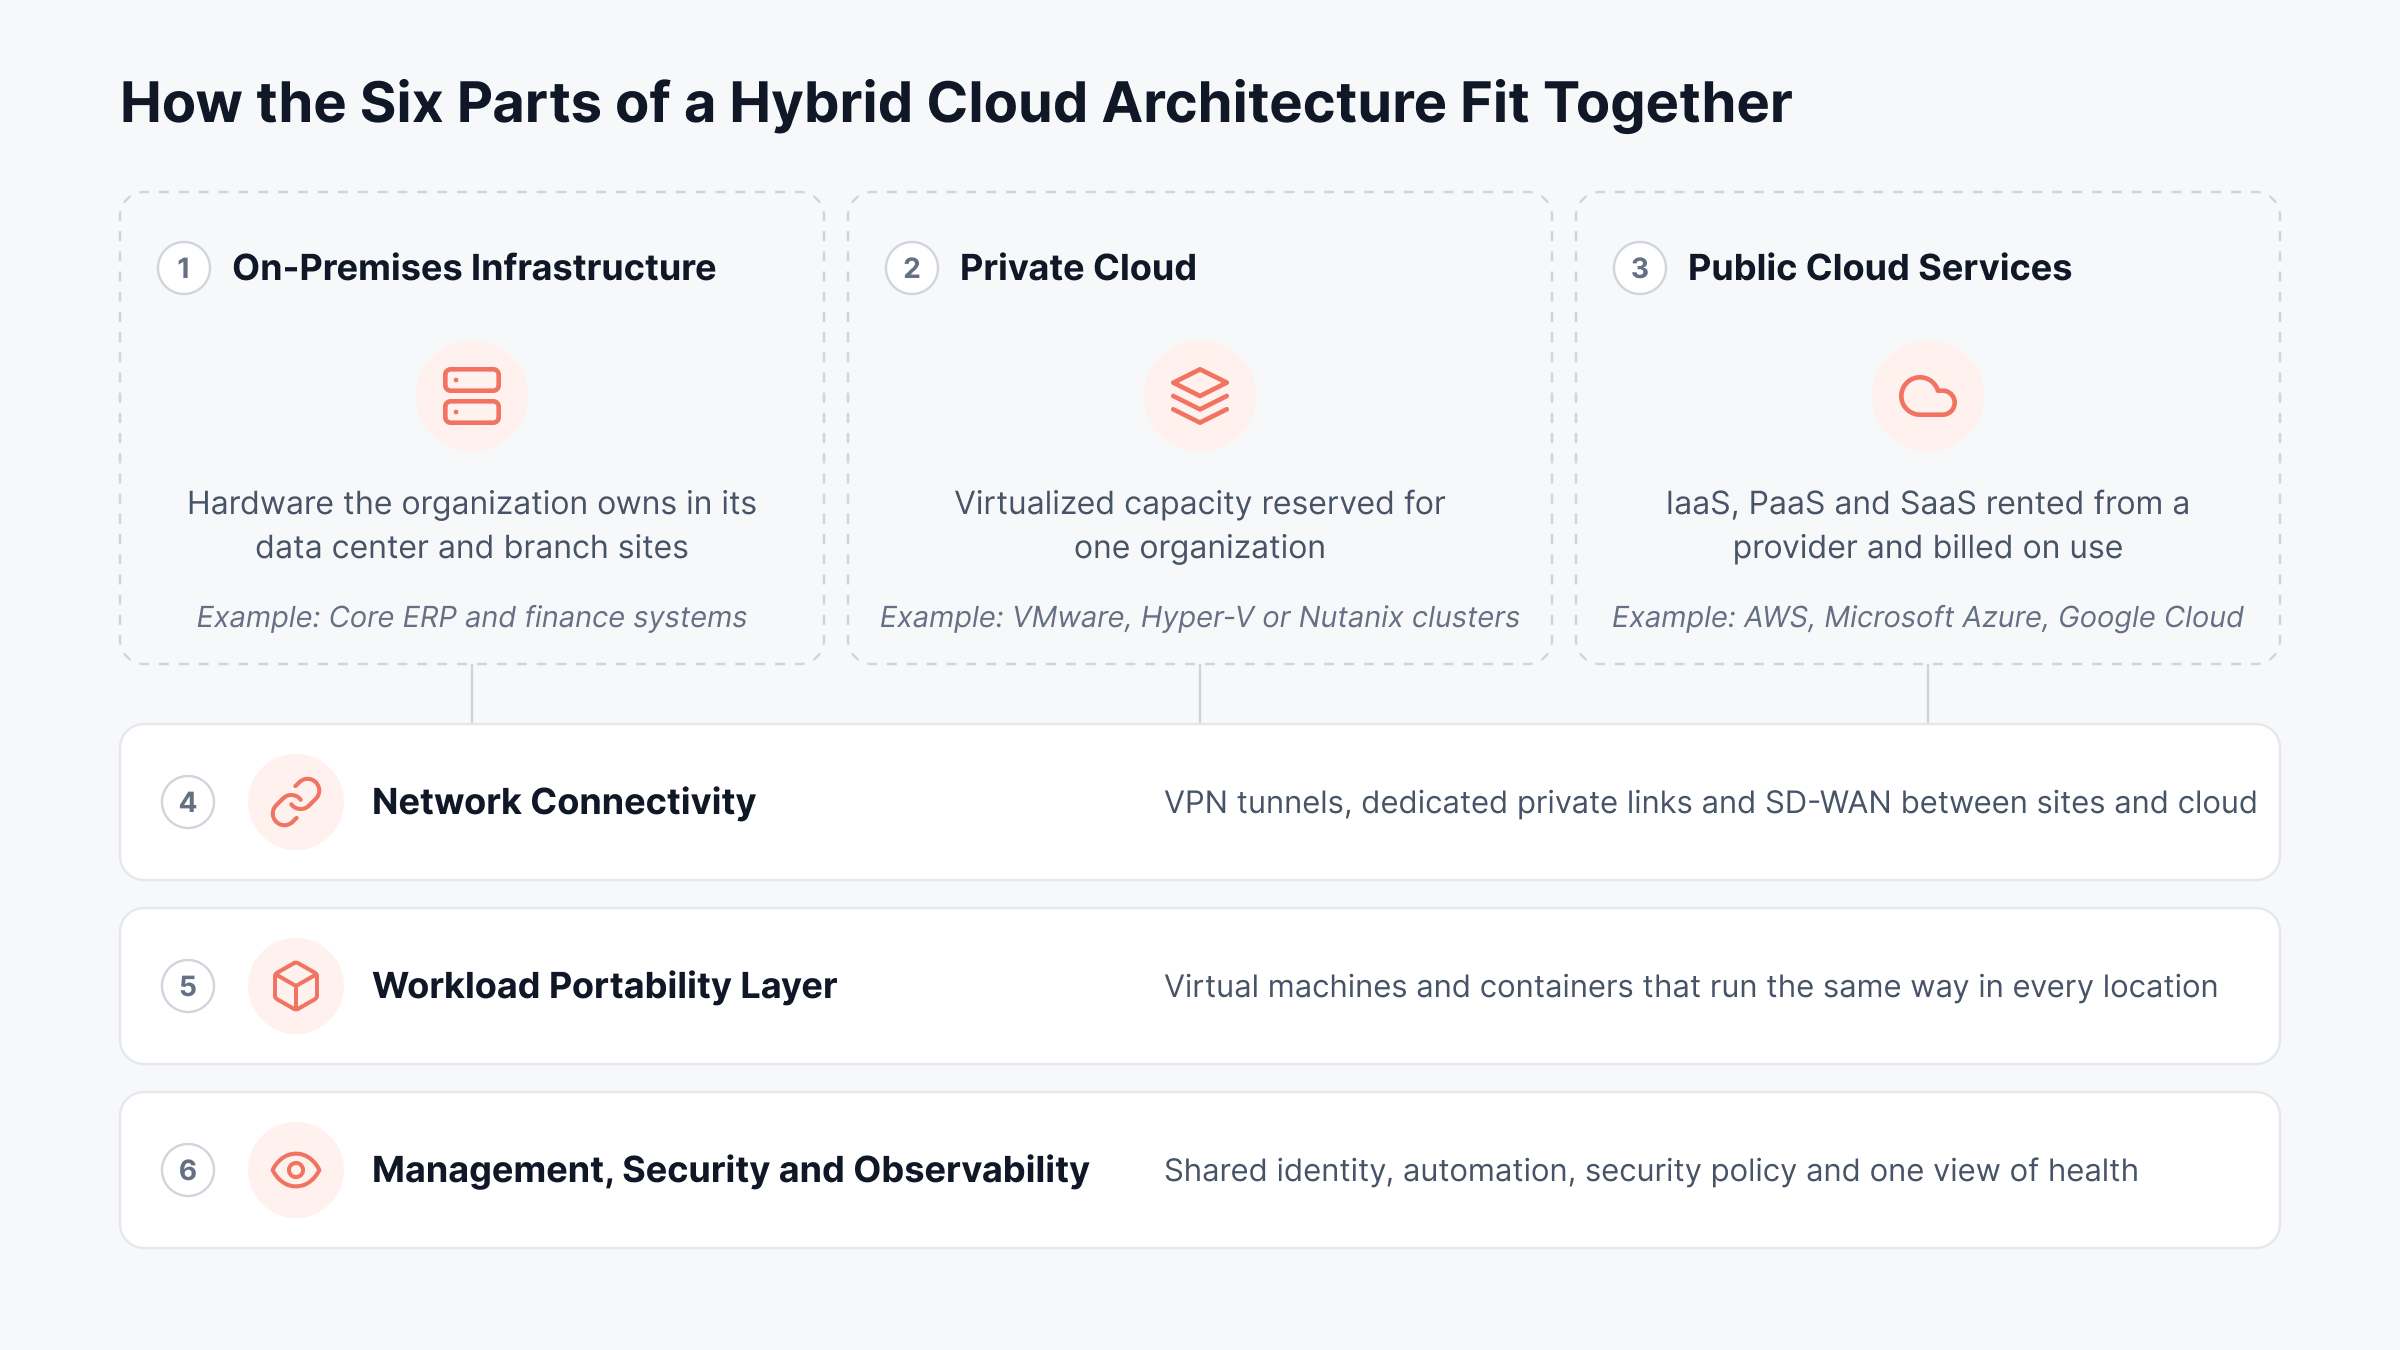
Hybrid cloud architecture has six core components: three places where workloads run, plus the network, portability and management layers that join them.
Map your own environment against these six parts before choosing any tooling. The hybrid cloud architecture diagram below separates the places where workloads run from the layers that connect and manage them.
1. On-Premises Infrastructure
On-premises infrastructure is the hardware an organization owns and runs in its own data center or branch sites: physical servers, storage arrays, switches, routers and firewalls. It usually holds the systems that are hardest to move, such as a core banking ledger, a plant's manufacturing execution system, or a database licensed per physical core.
These are often the systems of record behind revenue, so their health shapes how every cloud-facing service performs. The usual data center monitoring basics apply, with extra attention to:
Host CPU, memory and disk latency on servers that cloud services call
Interface errors and utilization on core switches and edge routers
Hardware sensors: fans, power supplies, RAID status
2. Private Cloud
A private cloud is a pool of virtualized compute, storage and network capacity dedicated to one organization and offered to internal users on demand. Most run on a hypervisor such as VMware vSphere, Microsoft Hyper-V or Nutanix AHV, with virtualization turning a rack of hosts into capacity that can be split up as needed.
Contention is the usual blind spot: several VMs competing for the same physical CPU or storage. A VM can look idle from inside the guest while its host is starved, and since private capacity is bought up front, the same host data also tells finance when more hardware is due.
3. Public Cloud Services
Public cloud services are compute, storage, database and application services rented from a provider such as AWS, Microsoft Azure or Google Cloud and billed on usage. They come in three service models:
IaaS: Virtual machines, block storage and virtual networks, managed from the operating system up
PaaS: Managed runtimes and databases; the provider handles patching
SaaS: Finished applications such as email or CRM, used through a browser
Each step up the stack hands more work to the provider, along with some visibility. Spend also scales with usage, so cost belongs on the same screen as performance.
4. Network Connectivity
Network connectivity is the set of links that carries traffic between on-premises sites and cloud regions. Its quality sets the latency users feel, and it drives a large share of the cloud bill, since providers charge for data that leaves their network (egress).
Most designs use one or more of these options:
Site-to-site VPN: Fast to set up, runs over the internet, latency varies with internet conditions
Dedicated connection: Private circuit into the provider; steady latency and a monthly port fee
SD-WAN: Software-defined WAN that routes traffic across several links by policy, useful when many branches connect to the cloud
Plan redundancy here first. A single tunnel to a cloud region is a single point of failure for every application that crosses it.
5. Workload Portability Layer
The workload portability layer packages applications so they can run in more than one environment, using virtual machines, containers and orchestration platforms such as Kubernetes. Containers carry their dependencies with them. The same build can then run in a private data center and in a public region with the same behavior.
Portability still has limits. Data gravity (large datasets are slow and costly to move, so applications tend to stay near them), licensing and latency to a database often keep an application in place long after its code could move.
6. Management, Security and Observability Layer
The management layer is the shared control plane for identity, provisioning, policy, security and observability across every environment. Infrastructure as code tools define resources in templates, so on-premises and cloud builds follow the same rules.
Observability belongs in this layer from day one. Added after go-live, it tends to arrive one environment at a time, each with its own console, while the links between them go unwatched. Those links matter most once traffic starts moving, as the next example shows.
How Does Hybrid Cloud Architecture Work in Practice?
Hybrid cloud architecture works by splitting an application across environments and joining the pieces over private networks and APIs. A single user request can touch the public cloud, the data center and a private cloud within one second.
Here is a hybrid cloud example from retail. A mid-sized retailer runs its online storefront on public cloud instances, with inventory and pricing in an on-premises ERP and card payment records in a private cloud. Each order makes four hops:
Storefront: The shopper's browser reaches web servers in a public cloud region
Inventory check: The application queries the on-premises ERP over a site-to-site VPN
Payment: The order is written to the payment database in the private cloud
Sync: An overnight job copies sales data back to the cloud for analytics
Every hop is a dependency. Add 80 milliseconds of network latency to the VPN and checkout slows down, even though both ends report healthy; let the sync job grow and egress charges grow with it.
Trace your own most important transaction hop by hop before deciding what to monitor. The swimlane below shows where one order crosses an environment boundary and what to watch at each stop. 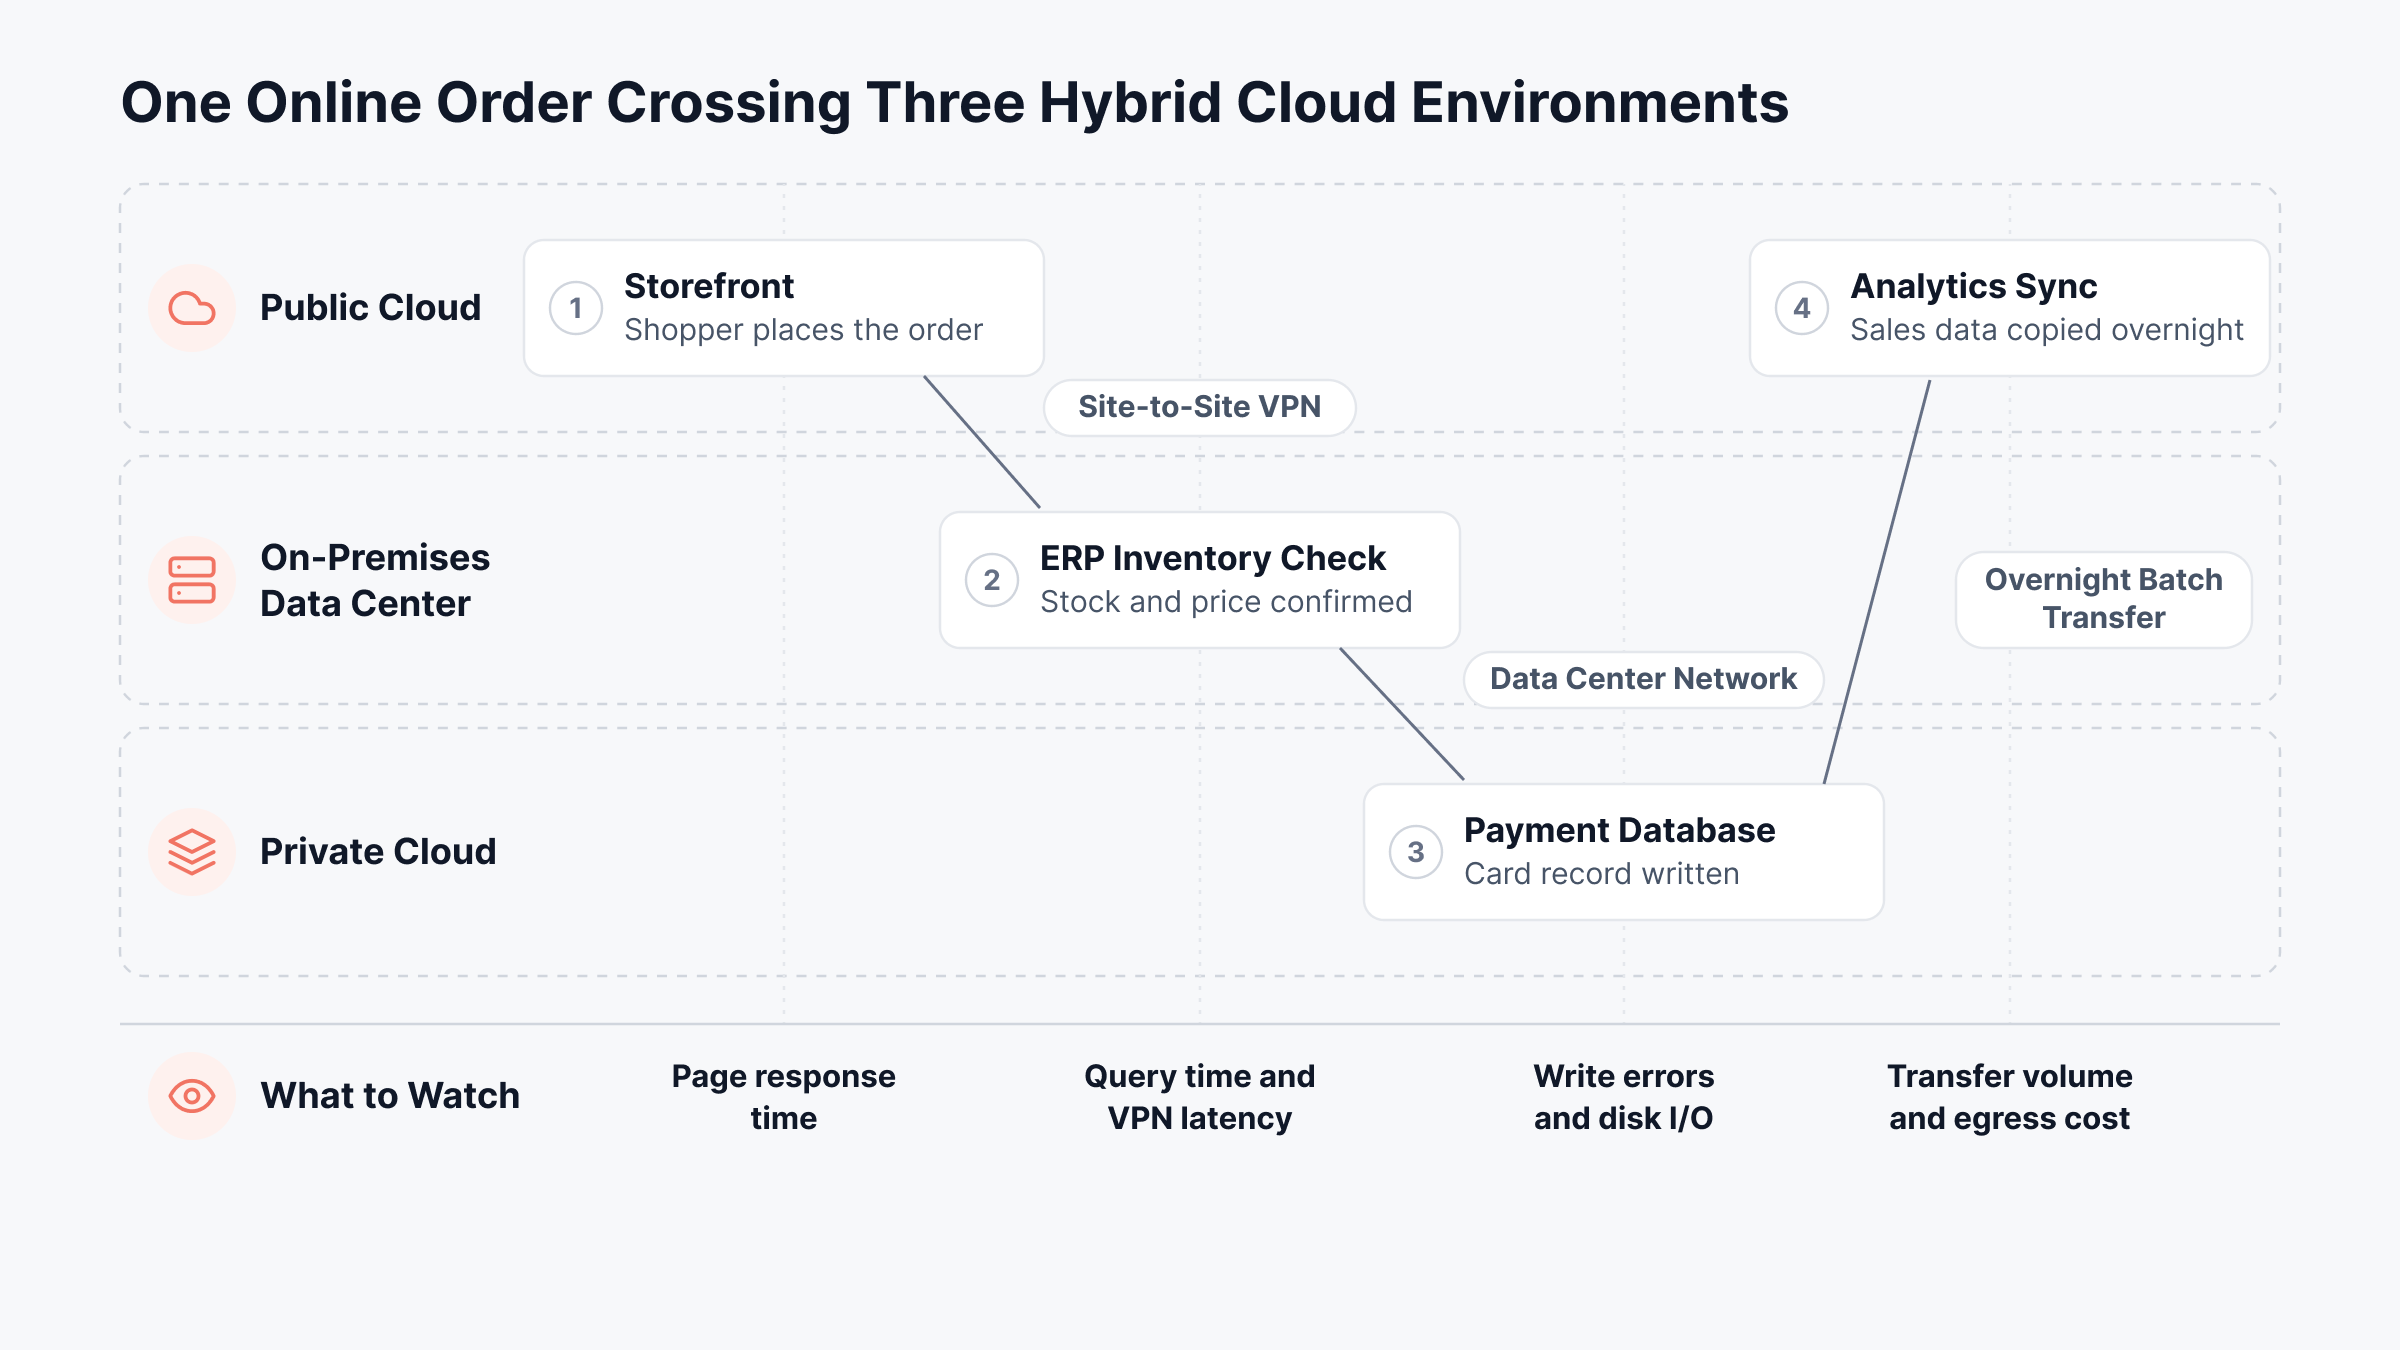
For the retailer, each of those crossings is a place where a slow page turns into an abandoned cart. The architecture model chosen up front decides how many such crossings there are.
What Are the Main Hybrid Cloud Architecture Models?
Hybrid cloud architecture models differ in two ways: how consistent the technology stack is across environments, and which deployment pattern decides where workloads run.
Heterogeneous vs Homogeneous Hybrid Cloud
A heterogeneous hybrid cloud mixes vendors, for example VMware in the data center with native AWS or Azure services in the public cloud. A homogeneous hybrid cloud extends one vendor's stack into both places, as AWS Outposts does with AWS hardware on site, or as Azure Arc does by bringing on-premises servers under Azure management.
Container platforms follow the same idea. An OpenShift hybrid cloud architecture runs one Kubernetes distribution, operated the same way, in the data center and in a public region.
Factor | Heterogeneous | Homogeneous |
Vendor choice | Pick the best option per environment | One vendor everywhere |
Skills needed | Several platforms to learn | One platform to learn |
Lock-in risk | Lower | Higher |
Operational consistency | Needs extra tooling to align | Comes with the stack |
Observability | Needs a vendor-neutral platform | Vendor tools cover their own stack; network and legacy systems need more |
Many enterprises end up heterogeneous even when they plan otherwise. Acquisitions, legacy contracts and team preferences add platforms over time.
Common Hybrid Cloud Deployment Patterns
A hybrid cloud deployment pattern describes which workloads run where, and why. Five patterns cover most designs:
Cloud bursting: The application runs on premises and borrows public cloud capacity during peaks such as tax season or a product launch. It needs matching images in both places and a load balancer that shifts traffic quickly.
Tiered split: Web and app tiers in the public cloud, close to users; databases and core records in the data center. Latency between the tiers decides whether this works.
Cloud backup and disaster recovery: The simplest example of hybrid cloud. Production stays on premises while the cloud holds backup copies and standby capacity; many organizations start here because it adds resilience without moving live systems.
Data residency split: Regulated records stay in one country or in a private cloud; analytics and customer apps use public services. Common in banking, healthcare and government.
Edge to cloud: Plants, stores or clinics process data locally for speed, then send summaries to the cloud for reporting. Each site turns into a small on-premises environment of its own.
Most organizations combine two or three of these. A bank might run disaster recovery in the cloud and keep customer records under a residency rule, then burst its mobile banking app at month end.
How Do You Decide Which Workloads Belong Where?
Workload placement in a hybrid cloud architecture comes down to six questions about data, latency, demand, dependencies, data movement and the cost of moving. The table below shows which way each answer points.
Question to ask | Points to on-premises or private cloud | Points to public cloud |
Is the data regulated or bound to a location? | Strict residency or audit rules | A provider region meets the rules |
How sensitive is it to latency? | Needs very low latency to machines or local users | Tolerates internet round trips |
How steady is demand? | Flat and predictable, all day and all year | Spiky, seasonal or still growing |
How tightly is it tied to legacy systems? | Many live calls to on-premises databases | Few dependencies, or loosely coupled through APIs |
How much data leaves the environment? | Large, frequent transfers back to the data center | Data stays mostly inside one cloud region |
What would a move cost? | Hardware-bound license or a major rewrite | Container-ready, or offered as a managed service |
Score each application. Applications that lean clearly toward the public cloud are the natural first candidates for cloud migration; where the answers split, the tiered pattern is usually the compromise.
Revisit the scores once a year. Prices, regulations and application designs change, and a placement that saved money three years ago can now cost more in egress than it saves in hardware.
What Are the Benefits and Challenges of Hybrid Cloud Architecture?
The main benefits of hybrid cloud architecture are placement flexibility, cost control and resilience. Its main challenges are operational complexity, consistent security and visibility across environments.
Benefits of Hybrid Cloud Architecture
Placement flexibility: Each workload runs where its cost, latency and compliance needs are best met
Cost control: Steady workloads on owned hardware, variable demand on rented capacity
Resilience: Cloud regions as recovery sites, with no second data center to build
Gradual modernization: Applications move one tier at a time, at a pace the business can absorb
Challenges of Hybrid Cloud Architecture
Operational complexity: More platforms, consoles and skills to maintain
Security consistency: Identity, patching and firewall rules that must match across environments
Unplanned network costs: Egress and private link charges that grow with cross-boundary traffic
Visibility gaps: Incidents that cross the boundary but surface in separate tools
The visibility gap has a measurable cost. According to IBM research, 40% of breaches in its 2024 study involved data stored across multiple environments; those breaches cost more than $5 million on average and took the longest to identify and contain, at 283 days. Much of that time goes into working out where a problem started.
What Are the Best Practices for Designing a Hybrid Cloud Architecture?
The best practices for designing a hybrid cloud architecture all aim at one outcome: fewer surprises at the boundary between environments. Seven practices make the biggest difference:
Start with an application inventory: Every workload scored on the placement questions above before anything moves
Design the network first: Redundant links to each cloud region, sized for peak sync jobs
Use one identity plane: A single directory and access policy for every environment
Tag everything the same way: Environment, application, owner and cost center on every resource
Keep security policy consistent: The same patching, firewall and logging standards on premises and in the cloud, in line with wider cloud security practice
Budget for egress: Data transfer costs estimated per application and reviewed every month
Build observability in from day one: One platform for metrics, logs, flows and traces before the first workload goes live
Most of these cost little to adopt at the start. Retrofitting them after the environment has grown is where budgets and timelines slip, and the last practice depends on knowing which signals to collect.
Which Signals Matter at Each Layer of Hybrid Cloud Architecture?
Each layer of a hybrid cloud architecture produces its own signals (metrics, logs, flows and traces), and each needs watching for the way that layer tends to fail. The table pairs those signals with what a bad reading usually costs the business.
Layer | Signals to track | Usual cause of a bad reading | Business impact |
On-premises servers | CPU, memory, disk latency, hardware sensors | A saturated host or failing hardware | Slow cloud-facing services |
Virtualization | Host CPU contention, datastore latency, VMs per host | VMs competing for one host or datastore | Paying for capacity that performs poorly |
Public cloud | Instance metrics, managed database load, service limits, spend | Undersized instances, throttling or idle resources | Slow apps or a rising monthly bill |
Network links | Latency, jitter, packet loss, tunnel status, traffic by application | A slow or flapping link between a site and the cloud | Failed syncs and slow checkout or login |
Containers | Pod restarts, node pressure, resource limits | Crash loops, or nodes out of capacity | Unstable releases and missed delivery dates |
Applications | Response time, error rate, traces across services | A slow dependency on the other side of the boundary | Lost transactions and more support calls |
Logs and events | Failed logins, configuration changes, cloud audit events | A security issue, or the change behind an incident | Audit findings and longer outages |
Two layers deserve extra weight. Network links carry every cross-boundary transaction, and logs are often the only record of what changed just before an incident.
Read together across layers, these signals add up to full-stack observability. The aim is to explain an incident as well as spot it, which the workflow below puts into practice.
What Does a Hybrid Cloud Observability Workflow Look Like?
A hybrid cloud observability workflow is a repeatable six-step process that runs from a complete inventory to alerts tied to business services. Monitoring tells you something is wrong; observability adds the context to explain why, a difference covered in our guide to monitoring vs observability.
1. Discover Every Asset in Every Environment
Start with one inventory that covers cloud accounts, hypervisors, network devices and applications. Cloud resources come from provider APIs, virtual machines from the hypervisor manager, and switches and routers from SNMP discovery.
Anything missing from the inventory will be missing from every dashboard built on it. The same inventory also feeds license and capacity decisions.
2. Map Dependencies Across the Boundary
Record which cloud service calls which on-premises database, and over which link. Automated topology mapping keeps that picture current as servers and routes change.
A dependency map turns a flood of alerts into one incident. When a VPN tunnel drops, the map shows every application behind it, and the alert for the link outranks the alerts for the services it carries.
3. Watch the Network Path Between Sites and Cloud
Track latency, loss and jitter on every tunnel and private link. Then collect flow records (NetFlow, sFlow or IPFIX traffic summaries from routers and switches) to see which applications use the bandwidth.
Flow data also answers the cost question: which application is pushing data out of a cloud region, and how much.
4. Bring Metrics, Logs and Traces Into One Data Model
Collect all three signal types with the same tags, so a trace from the cloud can be lined up with a log from the data center. OpenTelemetry gives applications one vendor-neutral way to emit traces and metrics wherever they run.
Agree on a minimum tag set before collection starts:
Environment: On-premises, private cloud, AWS, Azure or Google Cloud
Application: The business service name
Owner: The group that gets paged
Cost center: For chargeback and egress reporting
5. Set Baselines and Correlate Alerts
Static thresholds struggle in hybrid environments, since normal looks different at each site and at each hour. Baselines learn what normal is for each metric, and anomaly detection flags departures from it.
Event correlation then groups related alerts by topology and time. On-call engineers get one problem to chase, and fewer pages out of hours.
6. Tie Signals to Business Services and Cost
Group components into business services such as checkout, payroll or claims processing, and track each one's availability and response time. Add spend as a signal as well; a jump in egress or instance hours is often the first sign that a deployment changed traffic patterns, and it feeds straight into cloud cost optimization.
Before calling the setup complete, check that:
Every cloud account and hypervisor appears in one inventory
Each VPN tunnel and private link has latency and loss alerts
Critical applications have a dependency map that crosses the boundary
Alerts carry environment and owner tags
On-premises and cloud health appear on the same screen during an outage
For tool selection and wider practices, our guide to hybrid cloud monitoring goes further. The next section shows how we apply this workflow in our own platform.
How Does Motadata ObserveOps Bring Observability to Hybrid Cloud Architecture?
Motadata ObserveOps brings observability to hybrid cloud architecture by collecting cloud, virtualization, network, container, application and log data in one platform. Alert policies then learn what normal looks like in each environment.
For IT leaders, that means one inventory, one alerting model and one place to investigate across every environment. We built it for organizations that run data centers, branch sites and cloud regions side by side.
Cloud and On-Premises Discovery in One Inventory
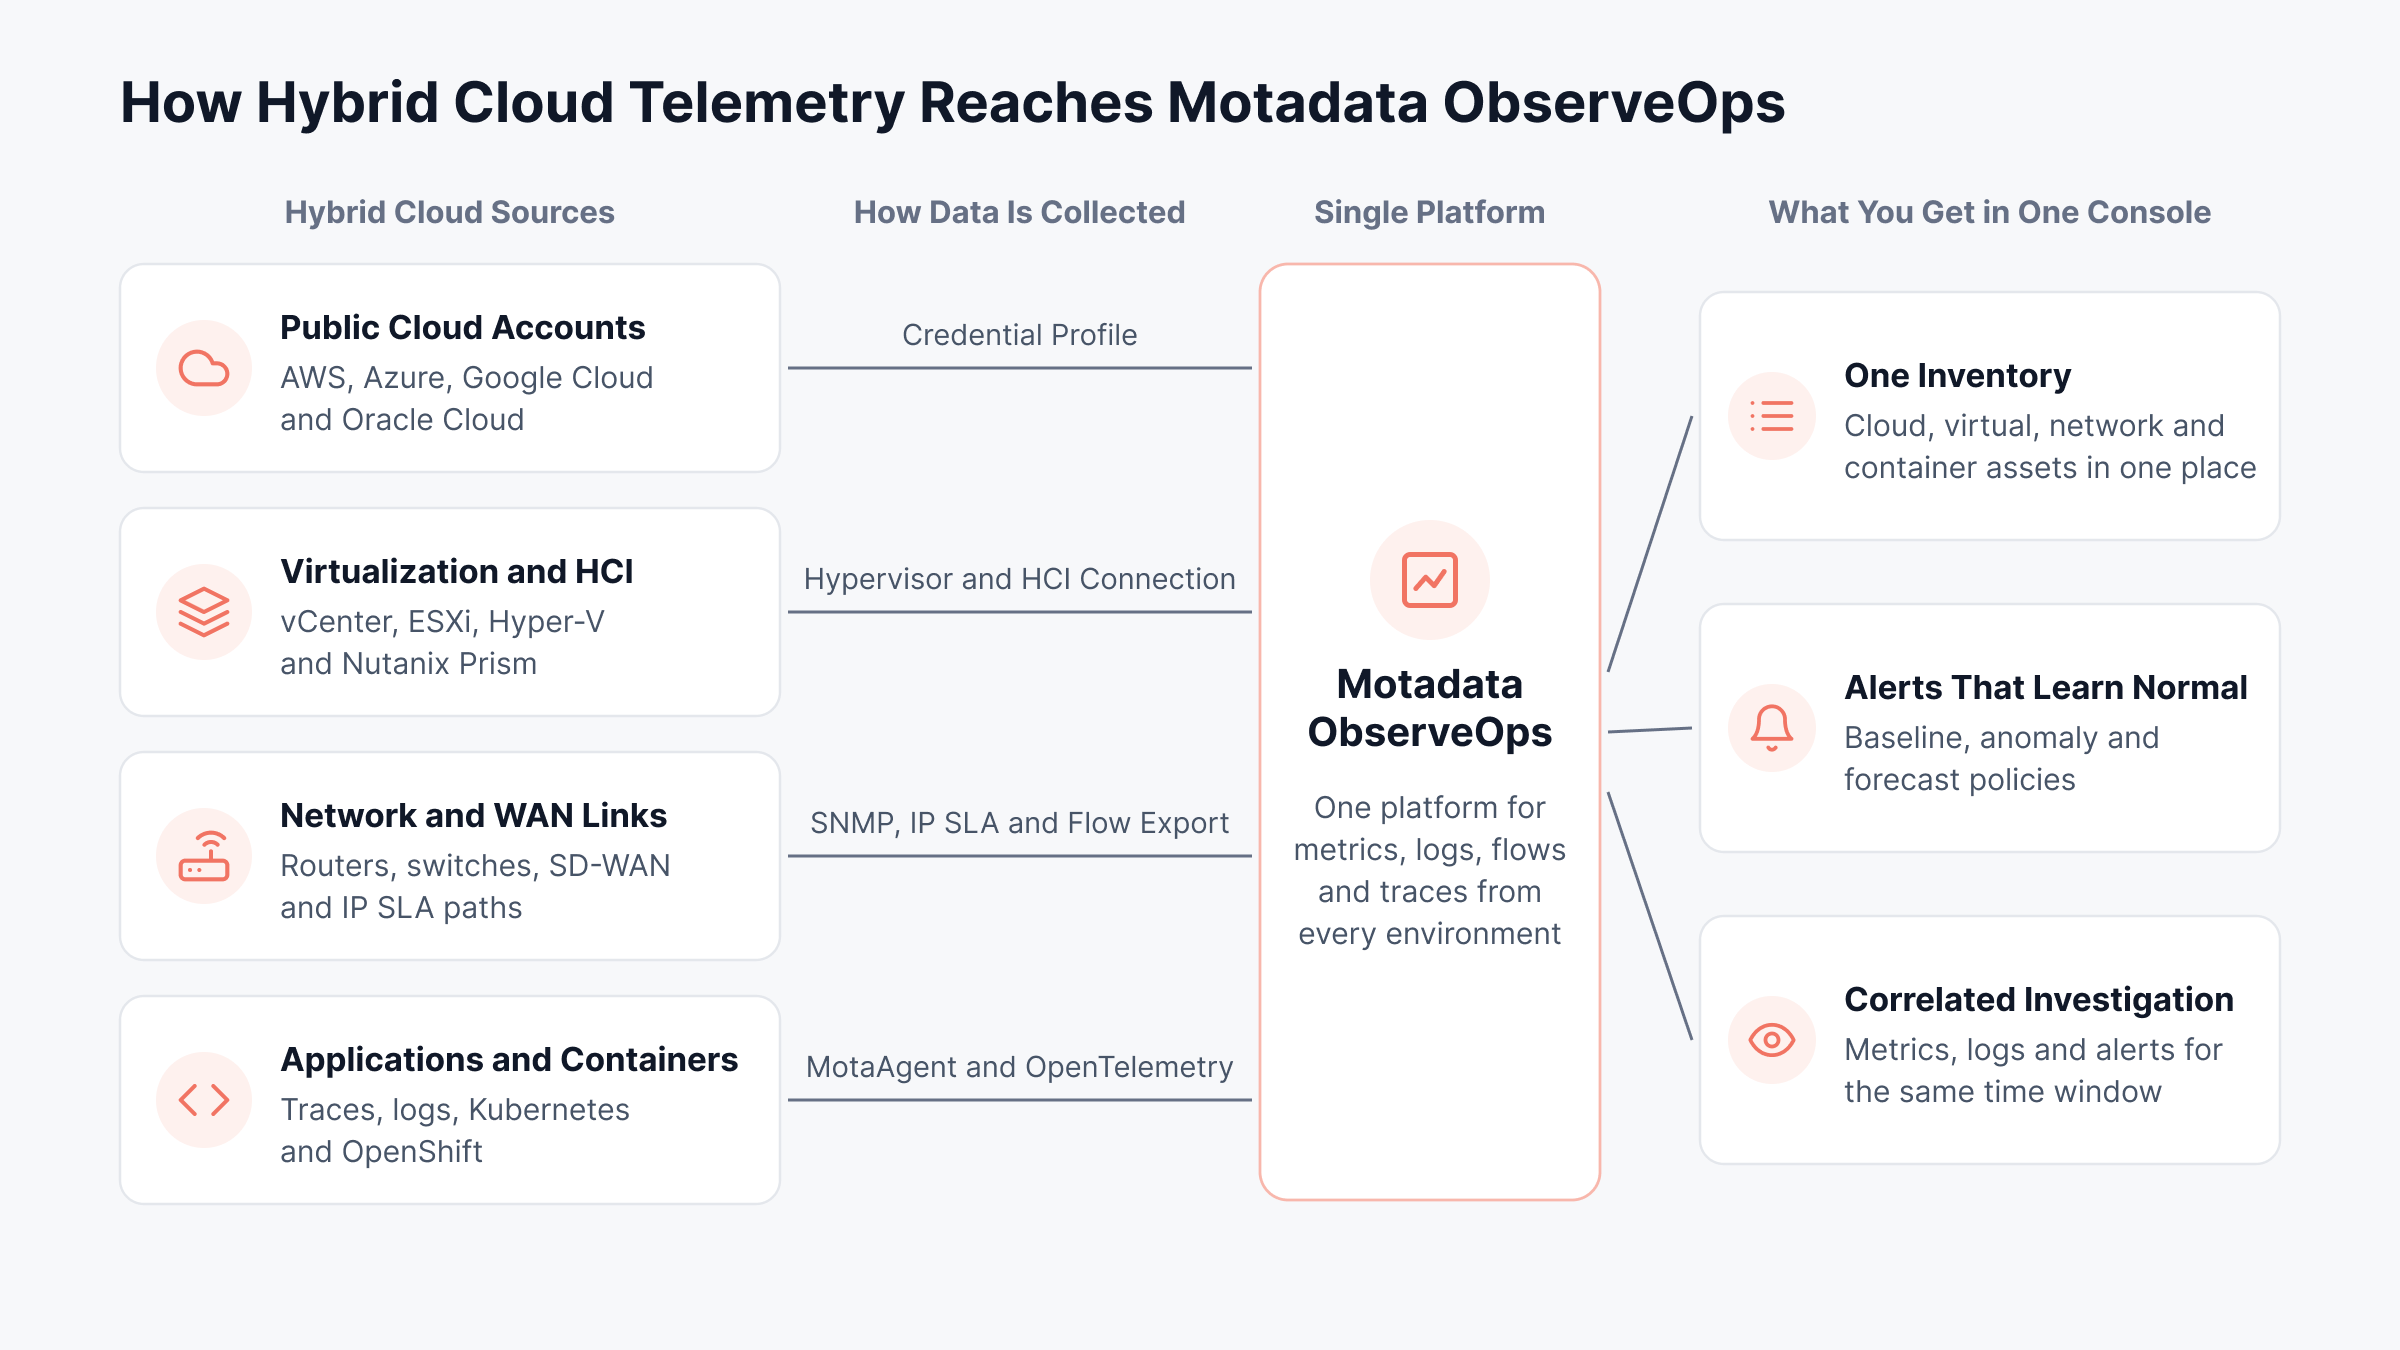
On the cloud side, a credential profile connects ObserveOps to AWS, Microsoft Azure, Google Cloud and Oracle Cloud, and discovery scans each account for resources such as EC2, RDS, Lambda and EKS. For Azure, one Monitoring Reader role assigned at the management group level covers every subscription beneath it.
On premises, we discover network devices over SNMP across an IP range or subnet. Virtualization monitoring covers VMware vCenter and ESXi, Hyper-V, Citrix Xen, Proxmox, KVM and Nutanix Prism, and Kubernetes clusters, including Tanzu and OpenShift, join the same inventory.
Network Path Visibility Between Sites and Cloud
Many hybrid incidents start on the links between sites and cloud, so we cover them from several angles:
WAN Link monitoring: Cisco IP SLA probes (test traffic sent across a link) for latency, jitter, packet loss and round-trip time, including a hop-by-hop path check
SD-WAN: Cisco Catalyst SD-WAN controllers, validators and WAN edges discovered along with their tunnels; Cisco Meraki, Cisco ACI and VMware NSX-T supported as well
Flow analysis: NetFlow, sFlow and IPFIX records broken down by application, protocol and conversation for traffic analysis
NetRoute policies: Alerts on a route from source to destination, and on each hop along it
Together these give network path visibility for the stretch of the architecture that cloud consoles and server tools do not cover.
Agent-Based and Collector-Based Data Collection
Different sites suit different collection methods. Agent-based monitoring through MotaAgent runs on Linux and Windows, collects metrics, logs and flows, and can poll as often as every second. MotaAgent also stores data locally while its connection is down, so readings taken during a short link outage are kept.
Where agents are not an option, a Collector deployed on its own VM takes in logs, NetFlow and sFlow and forwards them to the main server. For resilience across regions, ObserveOps also supports high availability over a WAN, with an observer node and primary and secondary servers.
Application Traces and Logs in One Investigation
Application monitoring splits each trace into spans and opens it as a flame chart with a Service Map, plus tabs for related logs, host, network and database data. We support Java, .NET, PHP, Node.js, Python, Go, C++ and Ruby. On Kubernetes, our agents use the OpenTelemetry operator, and eBPF instrumentation (kernel-level collection) covers hosts, Docker and Kubernetes with no code changes.
Logs arrive directly or through MotaAgent, including file logs and Windows Event Logs, with live tail and pattern detection in the same console.
Plan collection so every environment feeds one platform instead of its own console. The flow below shows how each type of hybrid telemetry reaches Motadata ObserveOps and what comes out the other side.
Baseline, Anomaly and Forecast Alerting with Alert Correlation
Every metric policy can use one of four condition types: Threshold, Baseline, Anomaly or Forecast. Baselines are learned by time of day and day of week; anomaly policies start working after eight hours of data, and forecast policies after a day, accounting for trend and seasonality.
When an alert fires, the Alert Correlation view lines up correlated metrics, logs, other alerts and log patterns for the same monitor and time window. Parent-child relationships in the Dependency Mapper, set automatically or manually, then show which downstream services an upstream failure affects.
Replace Separate Cloud and Data Center Views with One Console in Motadata ObserveOps
Hybrid cloud architecture gives each workload a better home, yet monitoring often keeps the old split: one tool for the data center, the provider's console for each cloud, and little coverage for the links in between. Motadata ObserveOps brings cloud accounts, hypervisors, network paths, applications and logs into one console, so a slow checkout can be checked against storefront traces, the WAN link and the ERP host without switching tools.
One caveat applies to every tool in this category: monitoring shows where a hybrid design is under strain, while placement choices, link sizing and tagging discipline still need owners who act on it. Start with the transaction that matters most to the business, map its path, and extend coverage from there.
FAQs
Is AWS a hybrid cloud?
AWS is a public cloud provider. It becomes part of a hybrid cloud when an organization connects it to on-premises or private infrastructure through VPN tunnels or dedicated links, or uses AWS Outposts to run AWS hardware inside its own data center.
What is hybrid architecture?
Hybrid architecture is a design that combines on-premises or private cloud resources with public cloud services and manages them as one environment. Shared networking, identity and management let an application in one location use services in another as part of normal operation.
What is an example of a hybrid cloud?
A common example is a retailer that runs its online store in the public cloud for elastic capacity while keeping inventory and payment systems in its own data center. Banks, hospitals and manufacturers use similar splits to keep regulated data close while scaling customer-facing services.
What is the difference between hybrid cloud and multi-cloud?
Hybrid cloud combines on-premises or private infrastructure with at least one public cloud. Multi-cloud uses two or more public cloud providers, with or without on-premises systems. An organization that does both runs a hybrid multicloud environment, with more providers and network paths to monitor.
Can one tool monitor both on-premises and cloud infrastructure?
Yes. Unified observability platforms collect data from cloud accounts, hypervisors, network devices and applications into one console. Motadata ObserveOps, for example, discovers AWS, Azure and Google Cloud resources alongside VMware, Hyper-V and network devices, so incidents that cross the boundary can be investigated in one place.
Author
Poonam Lalani
Content Strategist
Poonam Lalani is a B2B content strategist and writer with a background in computer engineering and experience across enterprise technology domains, including AI, cloud, DevOps, data engineering, and IT operations. She specializes in creating research-driven content that simplifies complex ideas and supports product education, thought leadership, and business growth.