Infrastructure Observability: What It Is and How It Beats Monitoring
Why does an outage that triggers dozens of alerts still take hours to explain? It's a common complaint in IT operations. Each device reports its own problem, and no alert says which failure came first.
Look at how infrastructure monitoring works. A server, a switch or a virtual machine gets checked against a limit someone set months ago; anything beyond that limit is for engineers to figure out, usually across separate consoles. Add data centers, branch offices and public clouds to the picture, and every hour spent figuring it out is an hour the business runs degraded.
Infrastructure observability fixes this by connecting signals your infrastructure already produces; an alert shows up with enough context to find the cause. Think of it as the observability vs monitoring question, applied to servers, networks and cloud. In this blog, you will see what infrastructure observability is, the eight gaps in monitoring it fixes, the business benefits and a six-step plan to implement it across hybrid infrastructure.
What Is Infrastructure Observability?
Infrastructure observability is the practice of collecting and correlating telemetry from servers, networks, storage, virtualization and cloud resources. When something breaks, it helps you answer one question quickly: why?
The idea comes from control theory. If you can work out a system's internal state from its outputs, the system is "observable". For IT infrastructure observability, those outputs already exist on every device (metrics, logs, flow records, events, configuration data), and they cover each layer:
Compute: Physical servers and hypervisors, plus the VMs and containers on them
Network: Everything from core routers to branch Wi-Fi and WAN links
Storage: Arrays, volumes, storage paths
Cloud: Instances, managed databases, serverless functions, Kubernetes
The difference is that these layers get connected. A storage latency spike, the VMs on that datastore and the application errors that followed appear as one chain of events. If basic coverage is still a work in progress, start with our infrastructure monitoring guide.
How Does Infrastructure Observability Differ from Application Observability?
Application observability follows a request through code, services and databases. Infrastructure observability looks at what's underneath. The two meet at the host, and in our experience a "slow app" often turns out to be a saturated disk or a congested WAN link.
Most incidents need both. Our observability guide covers the application side; this article stays with infrastructure.
What Signals Does Infrastructure Observability Use?
Infrastructure observability uses the three pillars of observability: metrics, logs and traces. On top of those, infrastructure has signals you won't find in application code, like flow records, device events, configuration state and topology.
The Three Pillars of Observability
Each one answers a different question:
Metrics: How busy something is, and how fast it responds
Logs: What happened and when (a failed login, a restart, a link going down)
Traces: Where a request spent its time as it crossed services and hosts; distributed tracing is built on them
Infrastructure Signals Beyond the Three Pillars
Guides written for application teams usually skip these. In an outage, they're often the first place we look.
Signal | Question It Answers | What It Shows |
Flow records (NetFlow, sFlow, IPFIX, jFlow) | Who is using this link, and for what? | Spots a backup job taking most of a branch WAN link |
SNMP traps and syslog messages | Did the device say anything on its own? | A link-down trap, seconds before users lose access |
Configuration state | What changed, and when? | Shows a firewall rule edited overnight, just before latency rose |
Topology and dependencies | What depends on what? | Lists every VM on a host that just lost its storage path |
Path and hop data | Where along the route is the delay? | Finds packet loss at one hop between a branch and a cloud region |
A metric tells you an interface is busy. Flow data tells you who is keeping it busy (which application, which hosts), and that is network observability in practice; flow analytics is the usual way to add it. With these signals in view, the gaps in traditional monitoring are easier to see.
What Are the Limitations of Infrastructure Monitoring?
The main limitation of infrastructure monitoring is that it only answers questions someone wrote down in advance, one device at a time. You get the symptom; the context needed to find the cause stays missing.
To be clear, monitoring still does that first job well. Here are eight places where its design stops helping, each with an everyday example and what it costs the business.
1. Static Thresholds Cannot Tell Normal from Abnormal
A fixed limit treats every hour of the week the same, and infrastructure load doesn't. Take a database server: 85% CPU during the nightly batch is healthy, while 60% on a quiet weekend afternoon may mean trouble.
So the threshold becomes a guess. Set it low and the batch job pages someone every night; set it high and the weekend problem waits until users complain.
Business impact: Tired on-call staff, missed early warnings
2. Polling Intervals and Averages Hide Short Spikes
Most monitoring polls every few minutes and keeps the average. A 30-second burst that drops packets on a core uplink vanishes into a five-minute average of 40%.
Users notice. The graph doesn’t.
Business impact: Slowdowns nobody can explain, complaints that keep coming back
3. One Failure Turns into Dozens of Alerts
Monitoring judges each device on its own. A distribution switch fails: the switch alerts, the access switches under it alert, the servers behind those alert. All inside a minute or so.
The on-call engineer now has to:
Work out which alert came first
Separate the cause from the downstream effects
Silence duplicates before more people get paged
All of that happens under pressure, and it's a big source of alert noise in infrastructure operations. The business sees it as a longer outage.
Grouping downstream alerts under the first device to fail cuts response time sharply in a network outage. In the diagram below, the left side shows ten separate alerts and the right side shows one root cause.
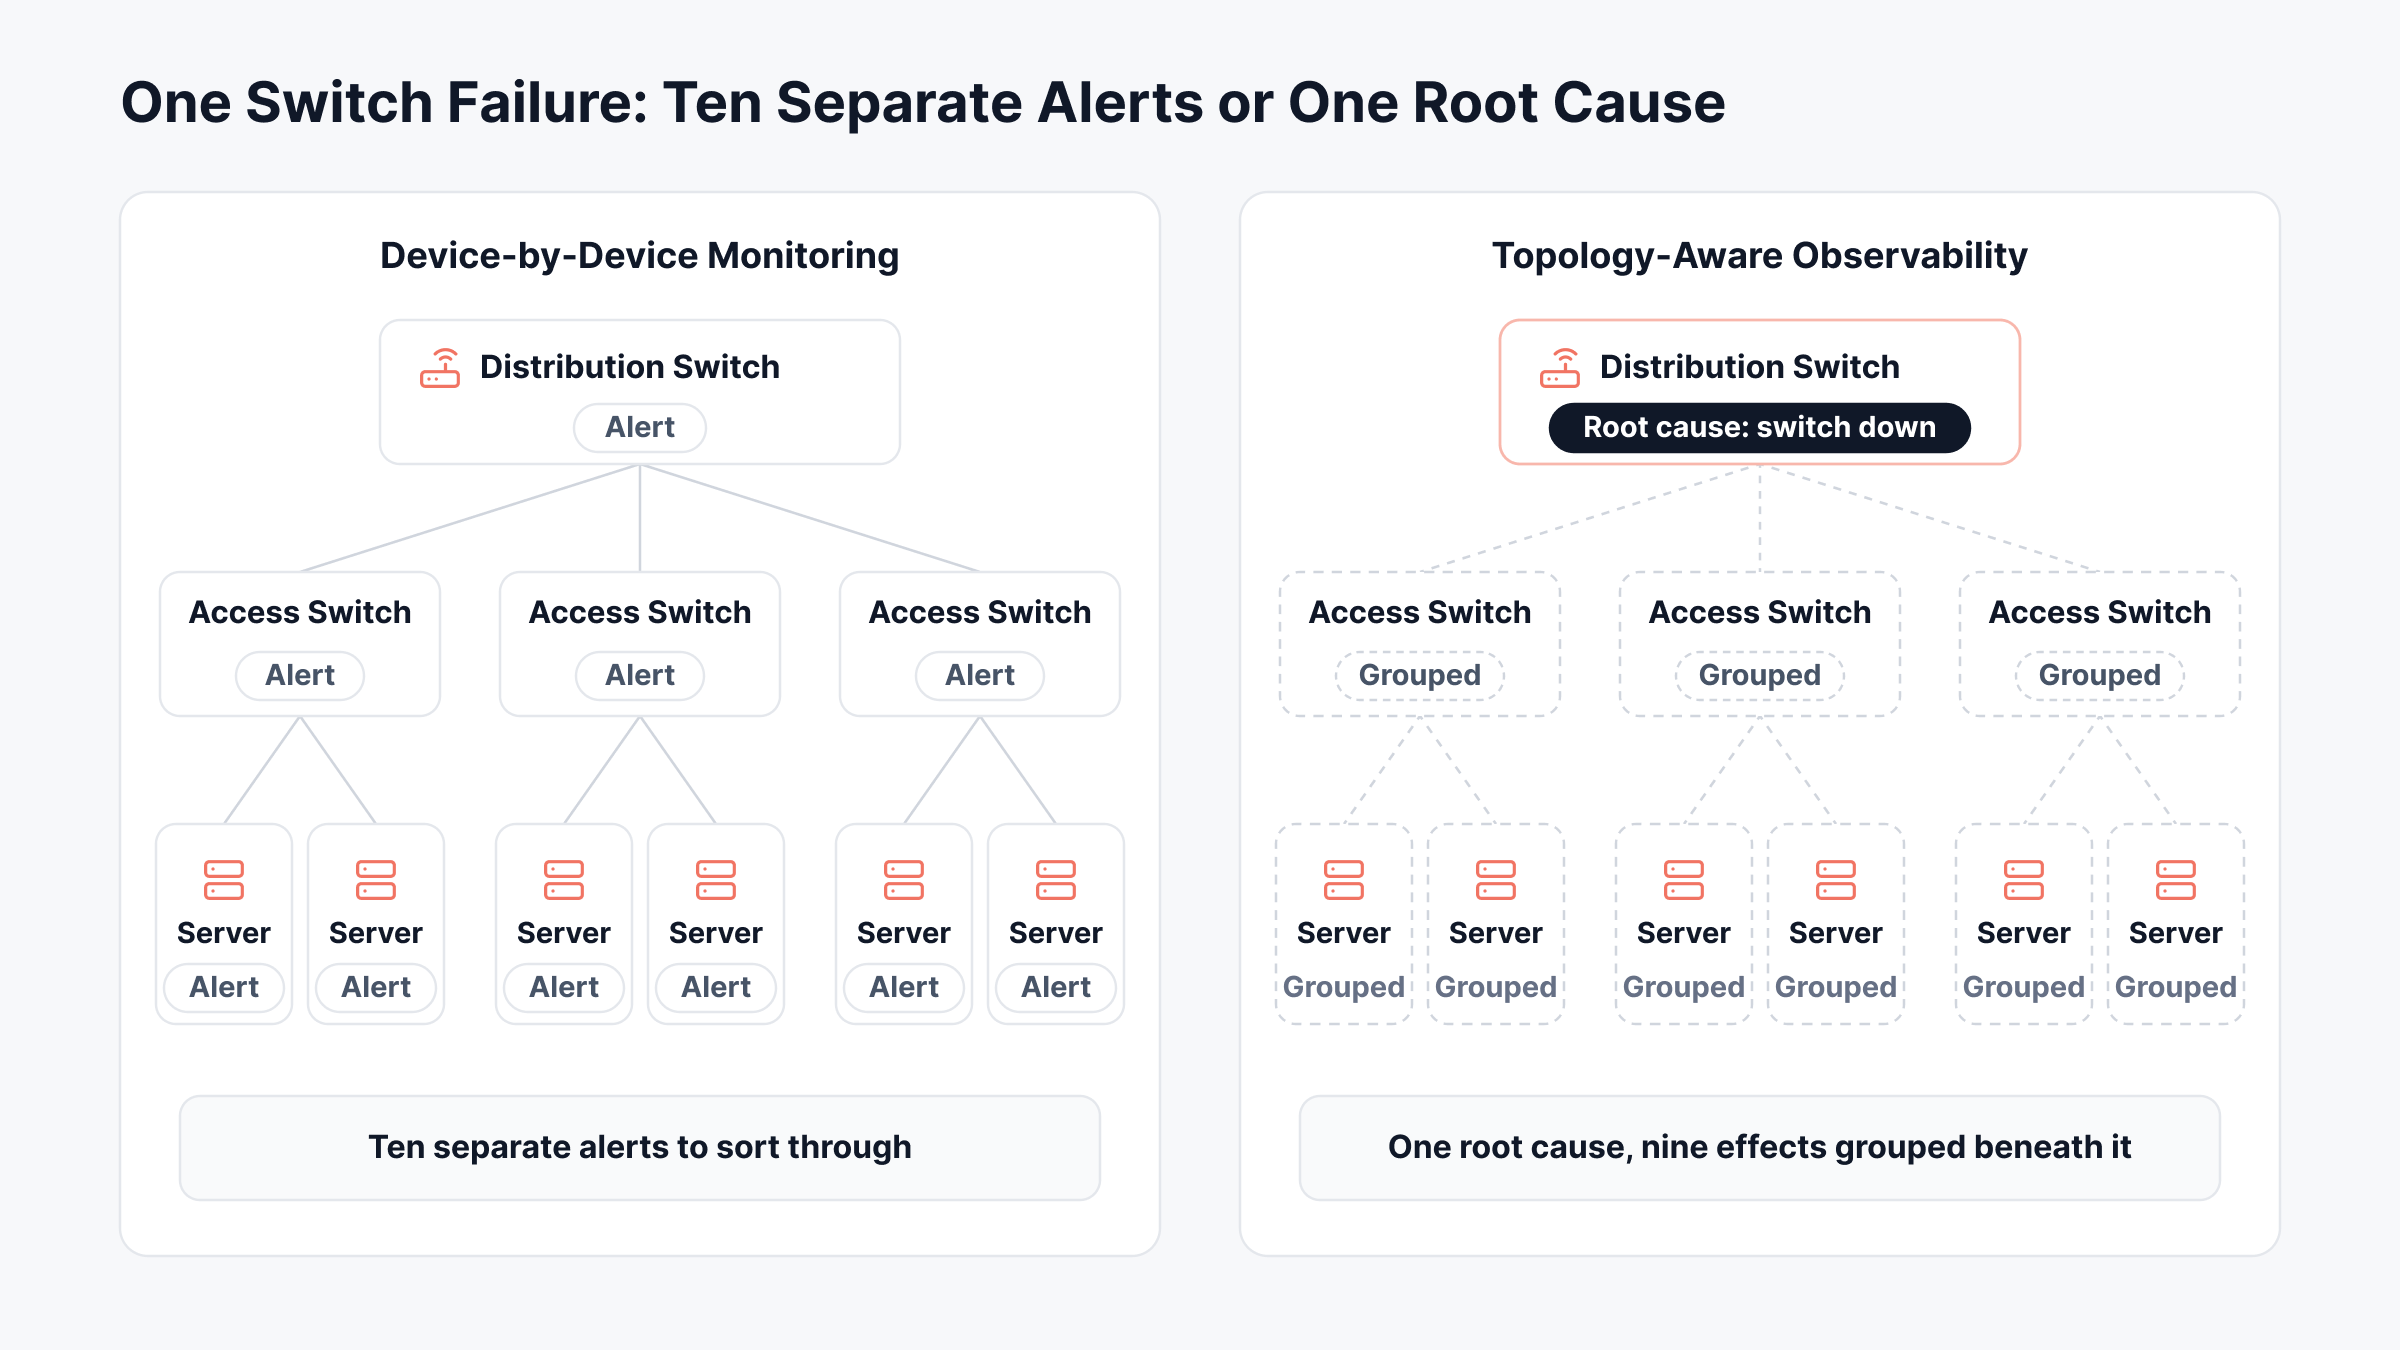
Same failure, very different workload. The deciding factor is whether the tool knows how devices connect, and that's the next gap.
4. Devices Are Watched Without Their Dependencies
A monitoring tool lists the host and lists the VM. Whether one runs on the other is usually missing.
Then a VMware ESXi host loses a storage path. Its VMs slow down, and the alert list shows two problems that look unrelated. Without dependency mapping, judging impact relies on someone's memory.
Business impact: "Low-risk" changes that break services nobody linked to that device
5. Signals Live in Separate Tools
Metrics in one console. Logs in another. Flow data in a third, and engineers lining up timestamps across browser tabs to check whether a log error and a latency spike are related.
We call this manual event correlation, and its speed depends on who is on call that night.
Business impact: Recovery times that vary by person
6. Interface Counters Cannot Show Which Traffic Is Responsible
SNMP interface counters (the traffic totals most tools collect) can tell you a WAN link is at 95%. They can't tell you whose traffic it is: a video call, a software update or a transfer to an unknown address.
Without that, there are two options: buy more bandwidth, or guess.
Business impact: Circuit upgrades bought for problems a schedule change would have fixed
7. Configuration Changes Go Unnoticed
Monitoring sees what a change did, never the change itself. Say someone edits a quality of service (QoS) policy overnight, the rule deciding which traffic gets priority. Next morning the dashboards show latency climbing; nothing on them points to the edit.
Edits like this pile up into configuration drift nobody can fully explain.
Business impact: The same change-related outage, more than once
8. Static Inventories Miss Dynamic and External Infrastructure
Monitoring works from a device list, and the list always lags. Auto-scaling groups, containers and short-lived cloud instances can come and go between two polls.
Then there is everything outside your own network. According to the Uptime Institute, third-party IT and data center providers were behind about two-thirds of publicly reported outages across nine years of tracking.
Business impact: Provider outages that land on internal IT anyway, with little proof of where they started
How Does Infrastructure Observability Beat Monitoring?
Infrastructure observability beats monitoring by putting every alert in context. You see the topology around it, the recent changes and the related signals; going from symptom to cause stops being a manual reconstruction job.
Here's how infrastructure monitoring vs observability compares on the eight gaps.
Area | Infrastructure Monitoring | Infrastructure Observability |
Question it answers | "Is this device within its limits?" | "Why is this service slow, and where did it start?" |
Thresholds | Set once and left alone | Learned from history, by time of day and day of week |
Short spikes | Lost in polling averages | Easier to catch as baseline deviations |
One upstream failure | An alert from every device behind it | One fault on the topology, effects grouped under it |
Dependencies | Rarely recorded | Discovered and kept on a live map |
Signal types | Mostly metrics, plus up or down checks | Everything from metrics and logs to flows, traps, configs and paths |
Configuration changes | Only visible through what they break | Recorded, then matched to the symptoms |
Scope | Whatever is on the device list | Whatever discovery finds, on-premises, in the cloud or at a branch |
Short version: monitoring flags the symptom. Observability gathers what root cause analysis needs to explain it.
Where Monitoring Alone Still Works
Observability builds on monitoring, and the existing checks stay. Some environments don't need more:
Small, stable environments: One site, a few servers, little change
Well-understood failure modes: Disk space, certificate expiry, service up or down
Availability reporting: Uptime figures that only need yes or no
Several sites, multiple clouds, a few virtualization layers: that's when fixed checks stop being enough, and when the business case for observability gets stronger.
What Are the Business Benefits of Infrastructure Observability?
The business benefits of infrastructure observability are mostly about time and money. Outages get shorter, engineers get hours back, capacity spending follows evidence, changes carry less risk and leadership gets clearer reporting.
Each of the five traces back to a gap above.
Shorter, less costly outages: In the Uptime Institute's 2026 outage analysis, 57% of respondents said their latest major outage cost over $100,000; for one in five it topped $1 million. Most of that cost builds while engineers are still asking "what broke?" That is the part observability shortens.
More engineering time for planned work: Fewer people pulled into each incident, and hours back for the projects the business is waiting on
Capacity spending based on evidence: Flow data and forecasts showing whether a link needs an upgrade or just a schedule change; capacity planning budgets spent where the growth is
Lower risk from changes: Configuration history beside performance data, and post-incident reviews based on facts
Clearer reporting for leadership: Service-level views for ERP, payments, customer portals and the other services leadership tracks
How Do You Measure Infrastructure Observability Success?
We suggest four numbers for checking whether observability is paying off:
Mean time to detect: How quickly a problem is noticed, tracked as MTTD
Mean time to resolve: How long services stay degraded once a problem is known
Alerts per incident: How much noise engineers sort through before reaching the cause
Repeat incidents: How often the same root cause returns within a quarter
Take a reading before the first change. Take another after each stage.
How Does Infrastructure Observability Work During an Incident?
Infrastructure observability works during an incident by following connected signals from the first alert to the cause. Every signal you add rules something out.
Here's a hypothetical case: a regional branch calls to say the ERP system has been slow since early morning. The monitoring console shows the branch WAN interface running hot and every device up. On that alone, you'd order more bandwidth; an observability workflow checks first:
Path: Hop-by-hop path visibility puts the latency and packet loss at the branch router's WAN uplink. The ERP servers and the data center core are ruled out.
Traffic: Flow records on that uplink show a software distribution job using most of the link since early morning
Change: An overnight edit to the QoS policy, found in configuration history; ERP traffic has lost its priority class
Fix: Old configuration restored. Distribution job moved to off-hours, and the cause logged on the incident.
Check the path, then the traffic, then recent changes, and a vague slowdown becomes a specific fix. The diagram below maps each step to its signal and to how far the search narrowed.
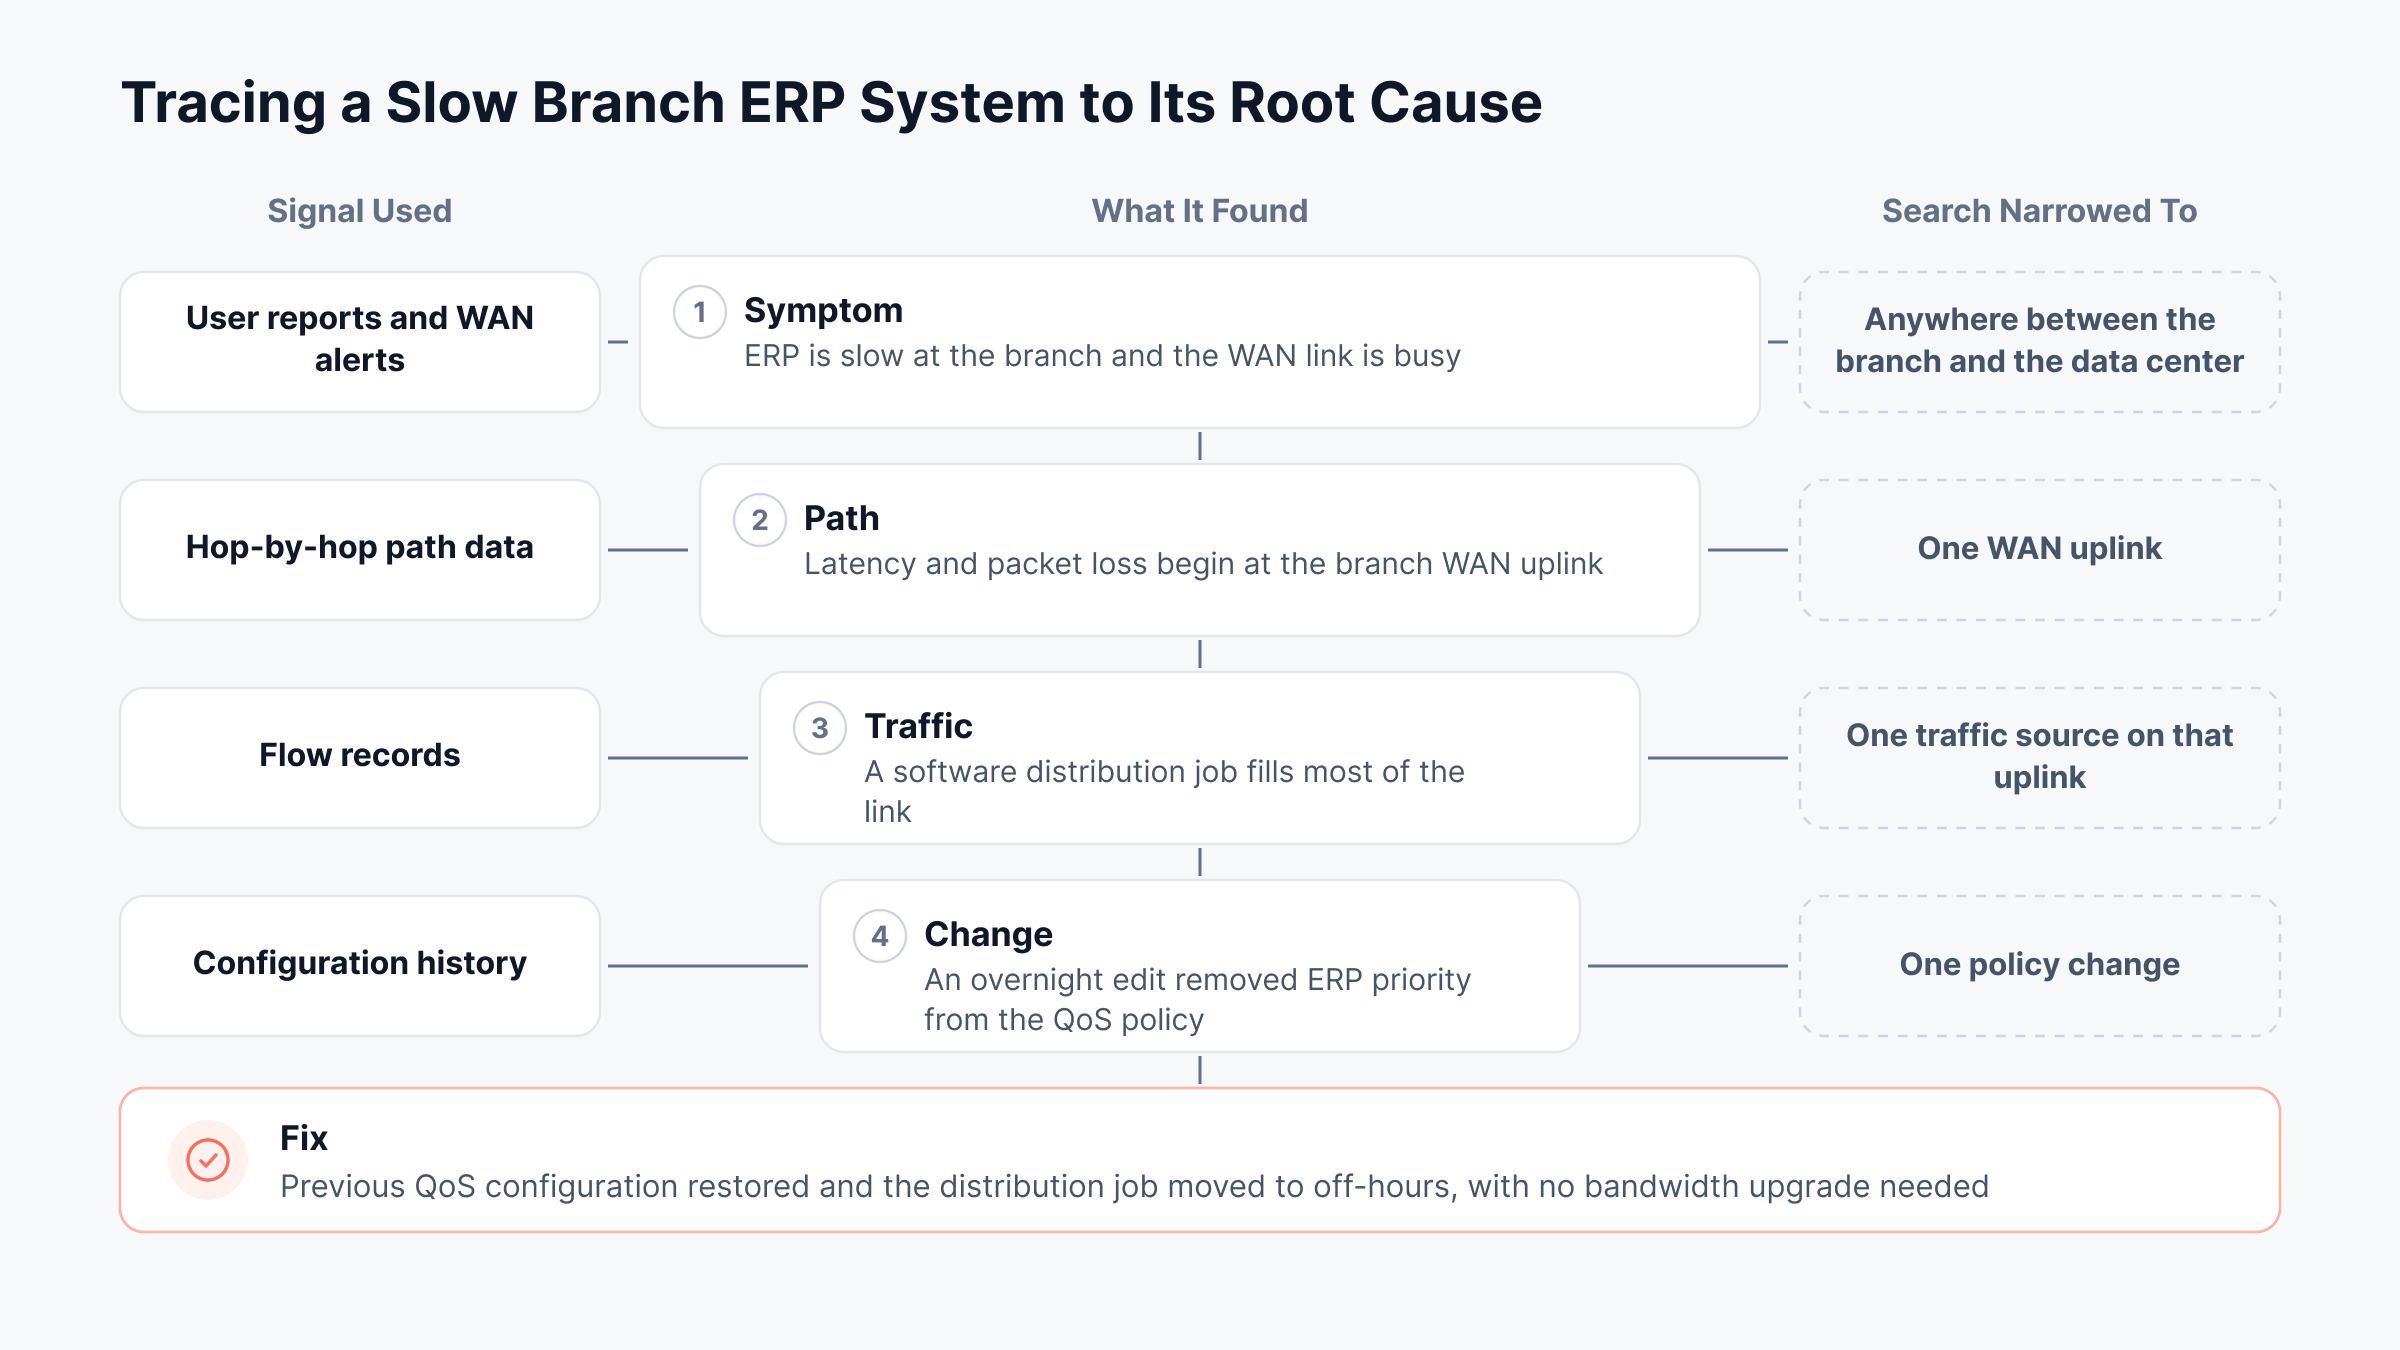
The branch never needs new bandwidth. Restoring a configuration takes minutes, and the circuit budget stays untouched.
How Do You Implement Infrastructure Observability?
To implement infrastructure observability, start with the business services that matter most. Map what they run on, then add signals, baselines and correlation a stage at a time.
This is the order we recommend, and it's how to achieve infrastructure observability without a disruptive migration. Every step pays off by itself. Pausing between them is fine.
Start with business services: Whatever hurts most when it's down (ERP, payments, the customer portal) and what it runs on
Discover and map dependencies: Network, hypervisor and cloud discovery first; scheduled scans after that, so the topology stays current
Add signals beyond metrics: Syslog and application logs. Flow export on core and WAN interfaces. Configuration backups, and OpenTelemetry wherever applications support it
Size the observability infrastructure: Collectors, pipelines and storage, each with its own capacity plan. Tag and label counts deserve a close eye (high-cardinality metrics can multiply storage costs).
Replace fixed thresholds with baselines: Noisy metrics move to baselines and anomaly detection. Disk capacity and other hard limits keep a fixed threshold; anything that fills up gets a forecast.
Connect alerts to response: Related alerts grouped and sent to incident management with severity attached, runbooks for repeat fixes, detection and resolution times compared stage by stage
What Challenges Come with Implementing Infrastructure Observability?
We see the same five challenges in most rollouts. Each one has a practical answer:
Data volume and cost: Retention by data type; full detail only where investigations need it
Another console to manage: A platform that brings several signal types together, keeping tool sprawl in check
Older equipment: SNMP and syslog coverage for legacy devices that cannot export flows or support discovery protocols
Shared ownership: A named lead for investigations that cross network, server and cloud domains
Baseline learning time: Baselines running beside existing thresholds until they have enough history
None of them is a blocker. They're scoping calls, best made early.
What to Look for in Infrastructure Observability Tools
Infrastructure observability tools vary a lot. Before you shortlist one, ask the vendor:
Does it discover topology automatically across network, virtualization and cloud?
Can it collect flows, traps, logs and configuration changes alongside metrics?
Does it learn baselines by time of day and flag anomalies without manual thresholds?
Can it show an alert next to related metrics, logs and alerts on one screen?
Does it support OpenTelemetry, plus agentless collection where agents cannot be installed?
Can it run on-premises, in the cloud or both, with collectors at remote sites?
If the answers are mostly yes, expect fewer consoles open during an incident. The last question matters most in hybrid environments.
What Is Hybrid Infrastructure Observability?
Hybrid infrastructure observability is the practice of observing on-premises data centers, branch sites and public cloud resources through one set of signals, baselines and topology. When a fault crosses from one to another, you can still follow it.
Hybrid is where monitoring gaps cost the most. Take one ERP transaction: it might pass a branch WAN link, an on-premises firewall and a cloud database, with a different tool and owner for each. Getting monitoring and observability for modern services and infrastructure right here takes three things:
Consistent collection: Same metrics, same baselines, same alert logic, rack or cloud region
Cloud integration through provider APIs: For AWS infrastructure observability, EC2, RDS, Lambda and EKS metrics beside on-premises data
Remote collection that respects the WAN: Collectors at each branch, polling locally and forwarding results
Our guide to hybrid cloud architecture covers the building blocks. Below, we show how our own platform handles them.
How Does Motadata ObserveOps Deliver Infrastructure Observability?
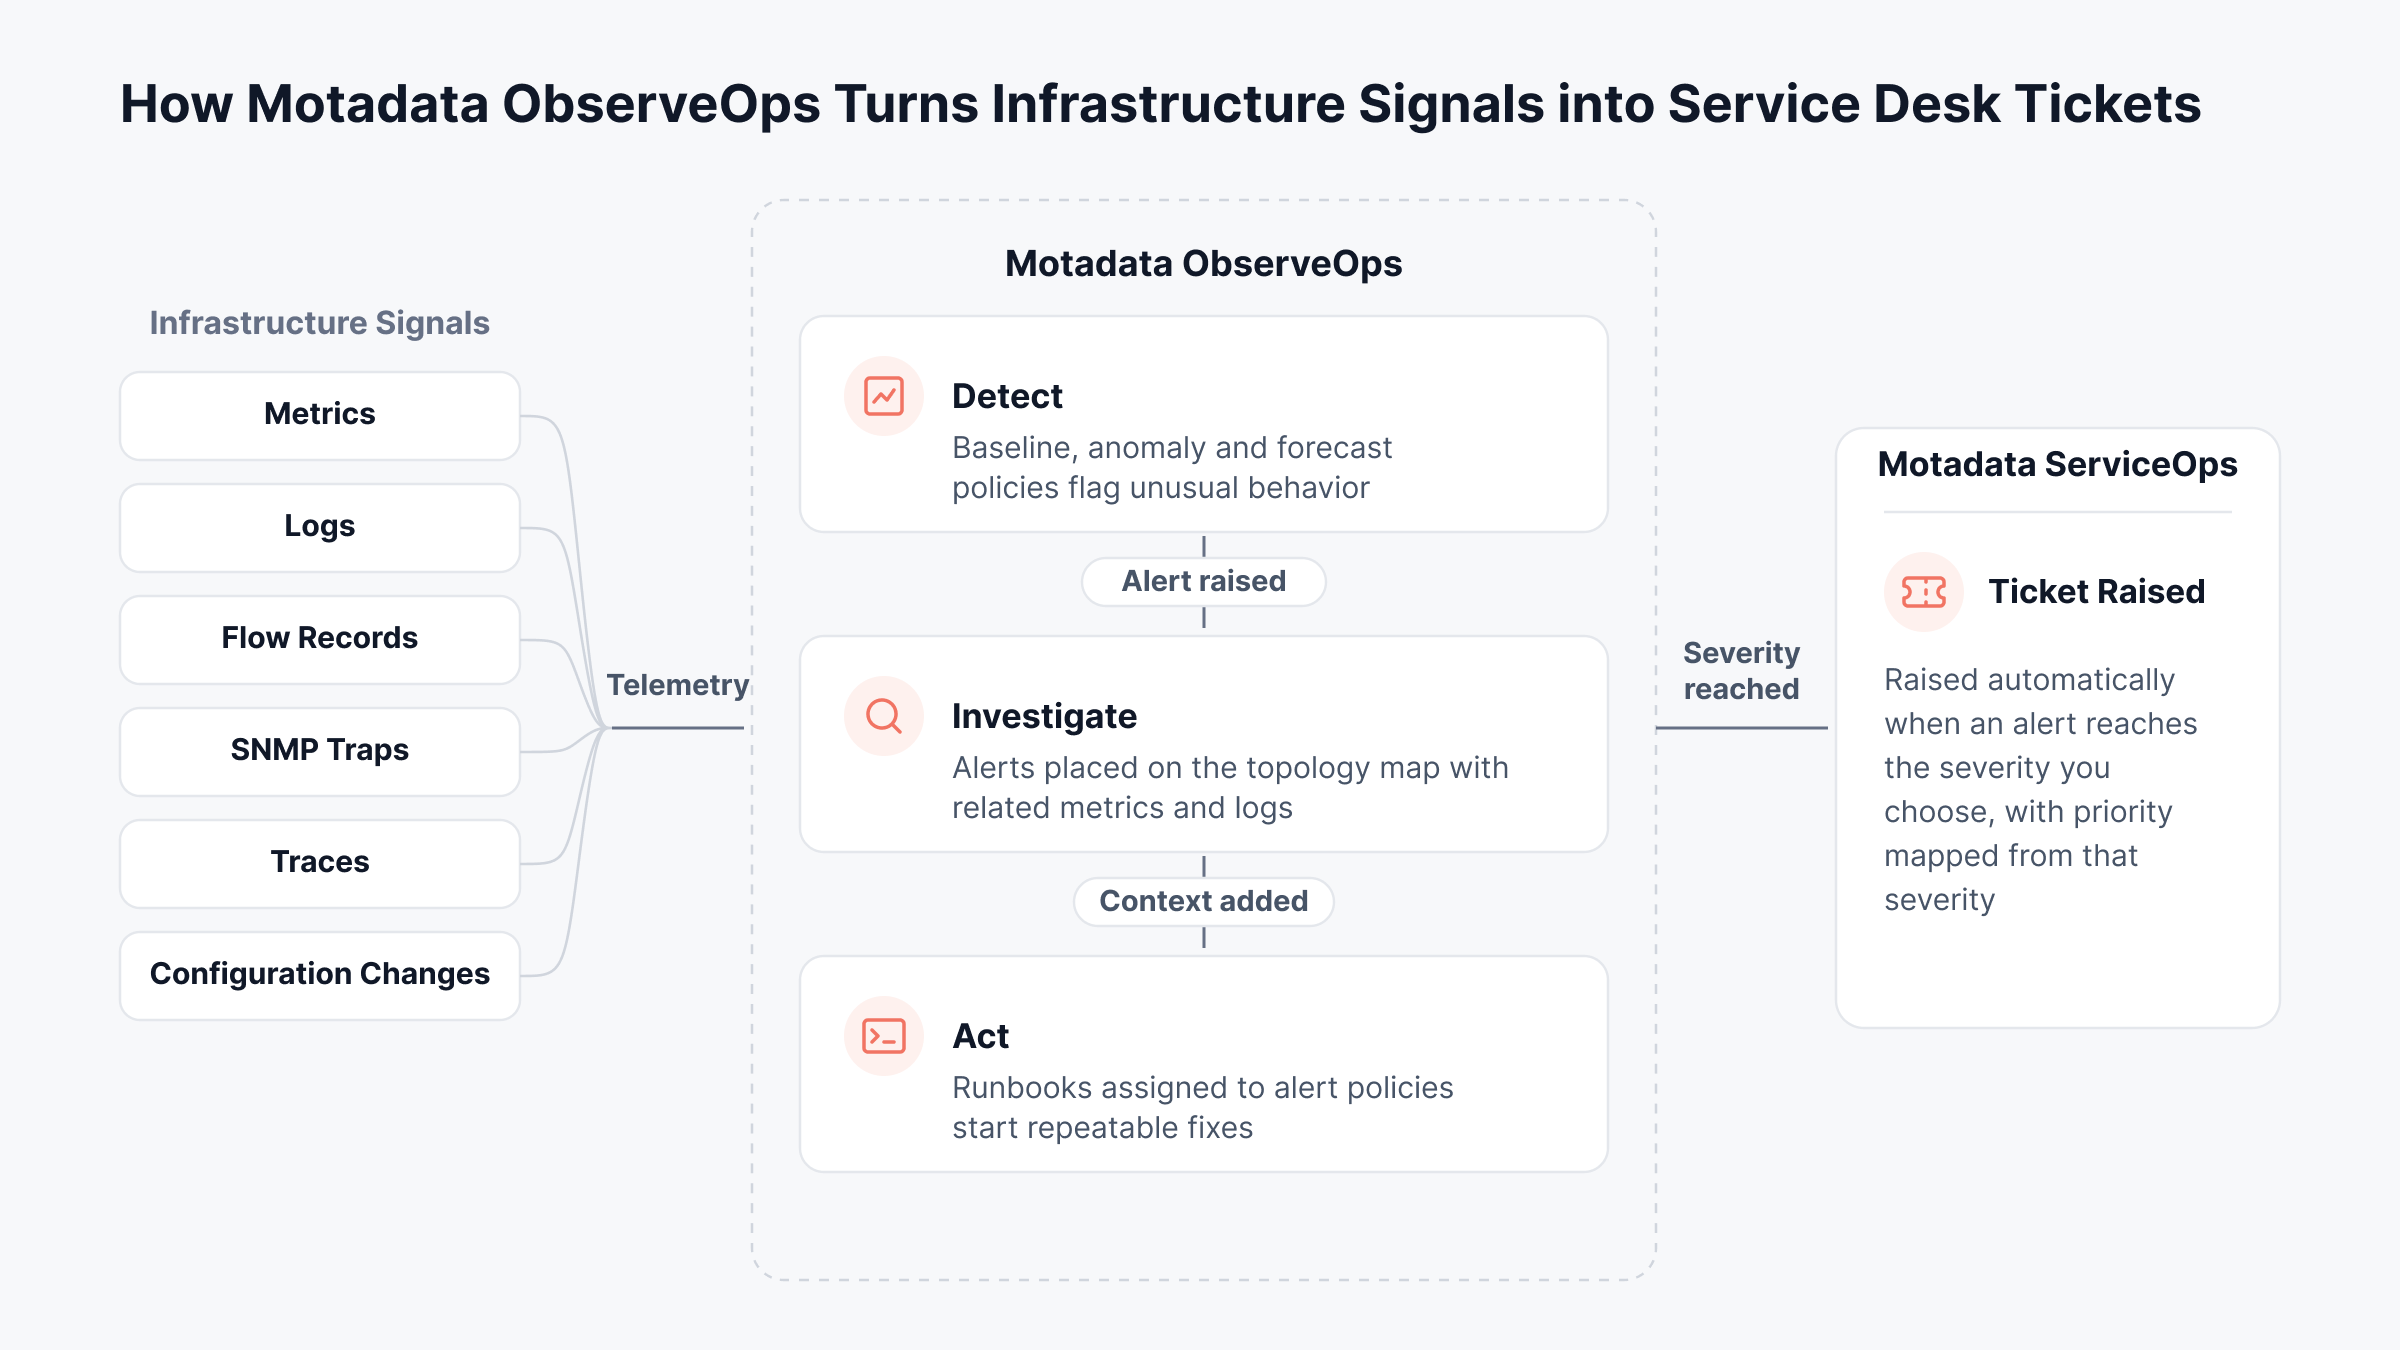
Infrastructure observability in Motadata ObserveOps starts with one platform for metrics, logs, flows, traps, traces and configuration data. Each alert is placed on a live topology of your environment.
We built the ObserveOps platform around the gaps above. It covers on-premises networks, servers and virtualization, and its cloud integrations include AWS, Microsoft Azure, Google Cloud and Oracle Cloud Infrastructure. Each capability below answers at least one gap.
1. Baselines and Forecasts That Learn What Normal Looks Like
Metric policies include a Baseline alert type, and it handles the batch-job problem. Each value is compared with the range learned for that hour and day of the week: the nightly batch stops paging anyone, and a weekday spike still raises an alert.
Anomaly policies begin after eight hours of polling history and check metrics, logs and flow data every 15 minutes. Forecast policies need 24 hours of history; they project a metric over a window you pick and alert when the projection crosses a limit. Capacity planners get early notice.
2. Topology That Shows Where a Fault Started
Our topology scanner begins at a seed device you choose and works outward through its neighbors, using supported Layer 2 and Layer 3 discovery protocols. Cloud, virtualization, SDN (software-defined networking) and HCI (hyperconverged infrastructure) maps skip the scan; polling data builds them.
Nodes are colored by health. A red distribution switch above a cluster of unreachable devices says it plainly: one failure, many alerts. Add the Dependency Mapper's parent and child links between devices and interfaces (found automatically or uploaded in bulk), and you get dynamic topology mapping across the hybrid environment.
3. One Investigation View for Metrics, Logs and Alerts
Open any metric alert and click Correlation. You get four tabs for the alert's active window, all from the same monitor: Correlated Metrics, Correlated Logs, Correlated Alerts and Log Pattern.
Say a CPU alert fires. The runaway process, the matching log lines and any related alerts show up on one screen, and that log correlation spares engineers most of the tab-to-tab timestamp matching.
4. Flow, Path and Configuration Data on the Same Platform
We collect NetFlow, sFlow, IPFIX, jFlow and NetStream from a wide range of network vendors. When someone asks "who is using this link?", the answer is next to the utilization graph. NetRoute policies watch the path between two points, either end to end or hop by hop, with threshold, baseline, anomaly and forecast conditions.
For configurations, network config policies raise an alert on a Config Conflict (a running configuration that has drifted from its approved baseline, for instance). They also alert on a failed backup.
5. Traces Without Code Changes
Some infrastructure problems surface in applications first. eBPF instrumentation collects traces from services on Linux hosts, Docker and Kubernetes without code changes, a tracing library or a restart. (eBPF is a Linux kernel technology that watches programs as they run; it needs the Motadata agent and a supported kernel.)
Our APM packages follow the OpenTelemetry instrumentation model, and their traces appear beside the host and network data underneath.
6. Alerts That Become Service Desk Tickets with Context
Once an alert reaches the severity you set, ObserveOps can open a ticket in Motadata ServiceOps by itself; priority comes from the severity mapping. A returning alert can reopen the closed ticket or open a new one, and closing the ticket in ServiceOps clears the alert in ObserveOps.
Runbooks attach to policies as well, and repeatable fixes start the moment an alert fires. For faults that keep returning, ServiceOps problem management ties the incidents to one problem record, with the root cause and any workaround.
Detection, investigation and the service desk record work best as one flow, with no handoff where context gets lost. The diagram below shows which signals feed ObserveOps, what happens inside it and where ServiceOps picks up.
Seeing every site in one place is the benefit users mention first, and this is what one of our clients says about Motadata ObserveOps on G2:
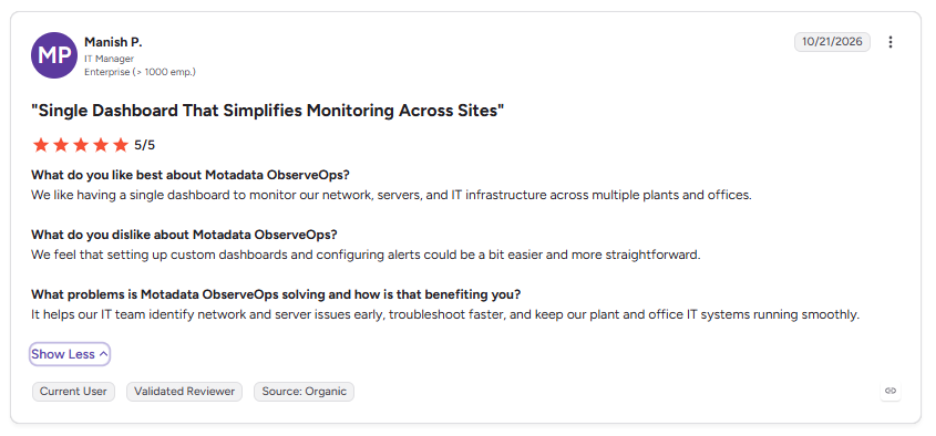
https://www.g2.com/products/motadata-observeops/reviews/motadata-observeops-review-13828726
Move from Isolated Alerts to Explained Incidents with Motadata ObserveOps
Monitoring tells you something crossed a line. Observability tells you what changed, what it affected and where it started. Yes, it asks more of an organization: broader data collection, matching storage, flow export or discovery protocols turned on, and some older or locked-down devices will always leave gaps.
ObserveOps narrows the rest by keeping baselines, topology, flows, configuration history and traces in one platform. The next outage starts with its context in view, and the business waits less for an answer.
FAQs
What is infrastructure observability in simple terms?
Infrastructure observability means being able to explain why servers, networks, storage and cloud resources behave the way they do, using the data they already produce. It joins metrics, logs, flows, configuration changes and topology, so engineers can trace a symptom back to its cause.
What are the three pillars of observability?
The three pillars are metrics, logs and traces. Metrics measure values over time, logs record individual events, and traces follow a single request across services. Infrastructure observability adds flow records, device traps, configuration state and topology, because many infrastructure faults only show up in those signals.
Does infrastructure observability replace monitoring?
No. Monitoring remains the layer that checks known limits and confirms availability, and observability builds on it to explain failures that fixed checks cannot catch. Most organizations keep their existing monitoring policies and add baselines, correlation and topology on top of them.
What is hybrid infrastructure observability?
Hybrid infrastructure observability covers on-premises data centers, branch sites and public cloud resources with the same signals, baselines and topology. It lets engineers trace a fault across environments, such as a branch WAN link slowing a cloud-hosted application. Platforms like Motadata ObserveOps do this through remote collectors and cloud integrations.
What should you look for in infrastructure observability tools?
Look for automatic topology discovery, support for flows, logs, traps and configuration data alongside metrics, and baselines that learn normal behavior. The tool should also connect alerts to incident management and run across on-premises and cloud infrastructure. Motadata ObserveOps combines these with ServiceOps for incident handling.
Author
Poonam Lalani
Content Strategist
Poonam Lalani is a B2B content strategist and writer with a background in computer engineering and experience across enterprise technology domains, including AI, cloud, DevOps, data engineering, and IT operations. She specializes in creating research-driven content that simplifies complex ideas and supports product education, thought leadership, and business growth.