8 Best Network Diagnostic Tools for 2026
If your team manages a network across several offices and cloud systems, finding the cause of a slow or failed connection can take time.
You may run into problems such as:
A server responds to ping, but users cannot open an application.
Packet loss appears only at certain times.
A link slows down, but you cannot see what is using the bandwidth.
You cannot quickly find the switch port connected to a device.
An outage ends before anyone starts investigating it.
As your network grows, a quick test from one computer may not show where the problem started or when it first appeared.
Network diagnostic tools help you check devices, ports, routes, packets, and link performance.
In this guide, we compare 8 network diagnostic tools, including what each tool does, when to use it, its limitations, and its pricing.
What are Network Diagnostic Tools?
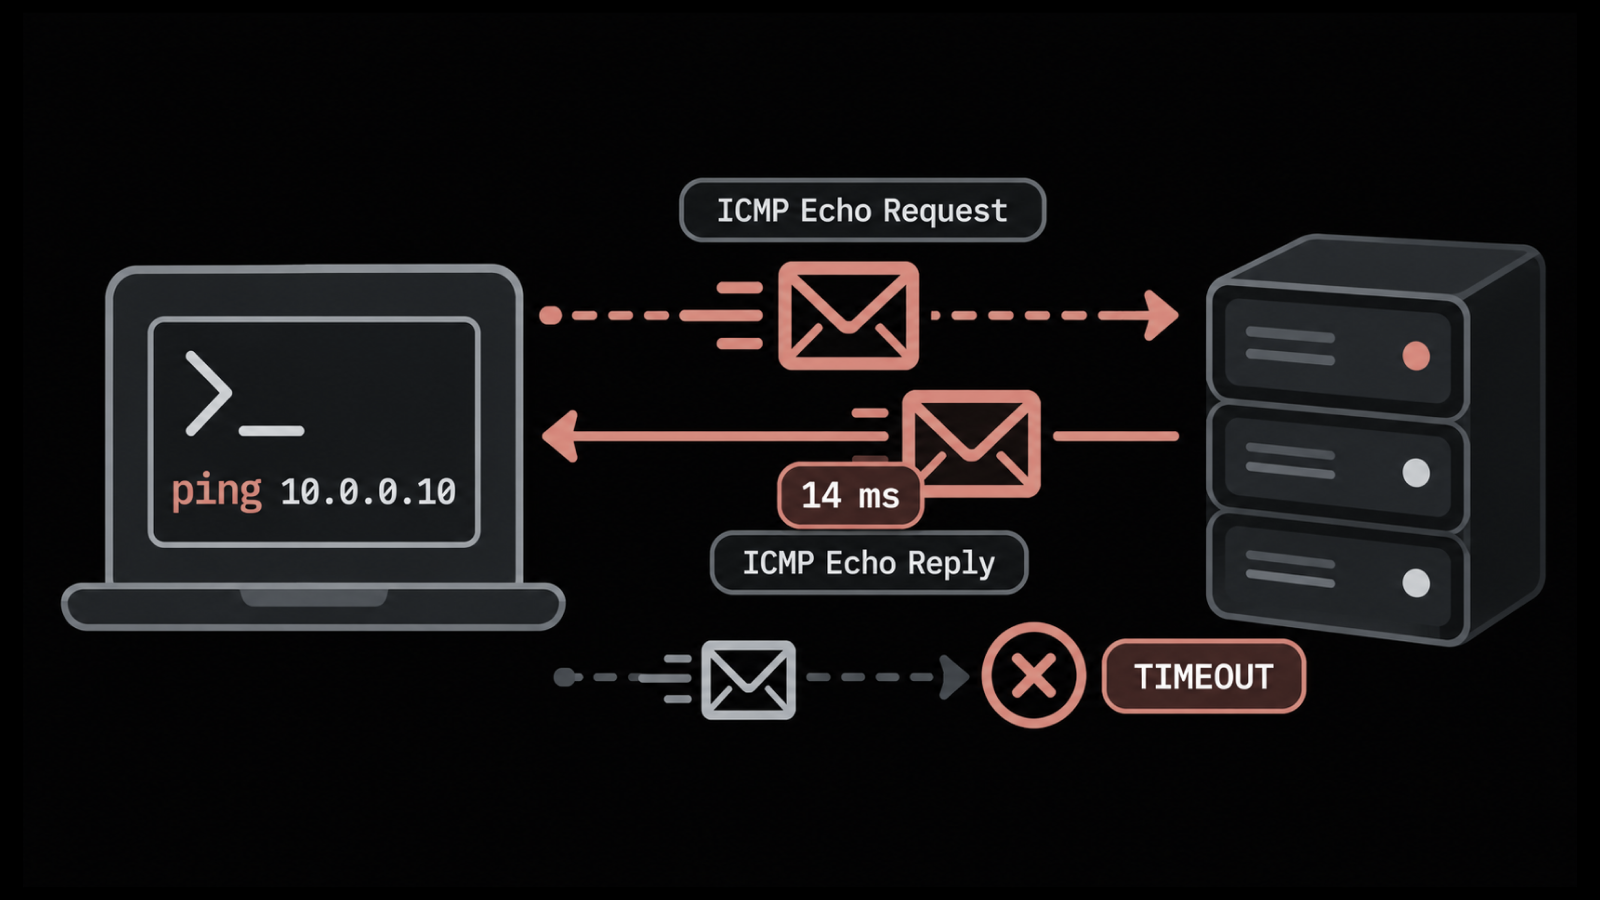
Network diagnostic tools help you find why a connection is slow, unstable, or not working. They can check whether a device responds, trace a network path, measure packet loss, test ports, or inspect network traffic.
Some tools run one-time tests, such as Nmap for device and port checks or iperf3 for link-speed testing. Others continuously monitor devices and network paths, keeping history that helps you find when a problem started and whether it keeps happening.
You may need both types of tools during a network investigation.
How We Selected These Network Diagnostic Tools
We selected tools that help investigate common network problems. The list covers device and port checks, route and packet-loss analysis, packet inspection, link-speed testing, and continuous network monitoring. Each tool has a specific role in finding and troubleshooting network faults.
For each tool, we checked:
What it can diagnose: The network problems the tool can help investigate and the information it provides.
How it runs: Whether it performs a one-time test or continues monitoring over time.
Where it runs: The locations from which it can run tests and the parts of the network it can monitor.
Pricing options: Whether it offers a free edition, free trial, or public pricing.
Limitations: What the tool cannot do, such as inspect packet contents, keep monitoring after a test ends, or run tests from multiple locations.
8 Network Diagnostic Tools Compared at a Glance
Let’s go through this table for a quick overview of all tools.
Tool | Best for | What it helps you check | Plan and starting price |
Motadata ObserveOps | Finding whether a problem comes from a device, a busy link, or a changed route | Device health, routes, flows, and alerts | Custom pricing: The quote depends on the modules and number of devices or data sources you monitor. |
SolarWinds Engineer's Toolset | Running ping, route, DNS, and port checks from one toolkit | Ping, DNS, routes, ports, and device data | Engineer's Toolset: Starts at $1,997. A 14-day free trial is available. |
Paessler PRTG Network Monitor | Watching devices and links continuously and getting alerts when something changes | Availability, interface traffic, and sensor history | Free plan: Up to 100 sensors. PRTG 500 plan: $200 per month, billed annually, for up to 500 sensors. |
ManageEngine OpUtils | Finding which device owns an IP address and which switch port it uses | IP use, ports, discovery, and basic network tests | Free plan: One small network range, listed as a Class C subnet, and one switch. Professional plan: Starts at $345 for 250 IP addresses and switch ports. The billing period is not clearly stated. |
Datadog Network Monitoring | Troubleshooting network problems in cloud systems already monitored with Datadog | Traffic between cloud systems, device health, route changes, and packet loss | Cloud Network Monitoring: $5 per network host per month, billed annually. Infrastructure Pro plan: Starts at $15 per host per month and is also required. |
PingPlotter | Catching connection drops and slowdowns that happen at random times | Route changes, packet loss, and latency over time | Free plan: One connection with limited history. Standard plan: Starts at $6.99 per month. |
Cisco ThousandEyes | Checking why a cloud service works in one office but not another | Network and application tests from several locations | Annual subscription: Custom quote based on the type, number, and frequency of tests. |
Wireshark | Inspecting the packets sent between two systems | Captured packets and the messages exchanged between systems | Free software: No license fee. |
8 Best Network Diagnostic Tools for 2026
1. Motadata ObserveOps
Best for: Network teams investigating problems that could come from a device, heavy traffic, or a changed route.
Motadata ObserveOps monitors network devices, links, interfaces, traffic, and routes from one platform.
Its NetRoute feature follows a network path and keeps a history of route changes, latency, and packet loss. Engineers can also run a traceroute when they need to check a path right away.
ObserveOps also collects flow data to show which devices and applications are using a network link. When a link becomes busy, your team can check the traffic sources and destinations to find what is using the bandwidth.
For example, if users in one office report that a cloud service is slow, the team can check the route to that service, review the devices along the path, and look at traffic flows to see whether a busy link is causing the problem. Saved route history can show what changed even if the issue has already been cleared.
You can learn more about how route monitoring works in the Motadata NetRoute guide.
Pros
- Combines device, route, traffic, and topology monitoring.
- Saved route history helps investigate intermittent problems.
- Flow data helps identify bandwidth-heavy devices and applications.
Cons
- Pricing is not publicly listed.
- Device, flow, log, and NetRoute monitoring can be licensed separately.
Pricing: Custom pricing based on the modules and monitoring requirements. See the Motadata license guide for more information.
2. SolarWinds Engineer's Toolset
Best for: Network engineers who need several troubleshooting tools in one package.
SolarWinds Engineer's Toolset brings more than 60 network tools into one product. It includes utilities for ping, traceroute, DNS, port scanning, switch port mapping, SNMP, and syslog.
For example, if a device appears to be missing from the network, Ping Sweep can check a range of addresses for responding devices. If you know the IP address but do not know where the device is connected, Switch Port Mapper can help identify the switch port. DNS Analyzer can help when a hostname points to an unexpected IP address.
Engineer’s Toolset is mainly designed for checks that an engineer runs during troubleshooting. It is different from a network monitoring platform that continuously checks devices and sends alerts.
Pros
- Puts many network troubleshooting tools in one package.
- Helps engineers check devices, DNS, ports, and network paths.
- Switch Port Mapper can help locate unknown devices.
Cons
- The full toolset may be more than you need for a single troubleshooting task.
- It does not replace a full network monitoring platform for continuous monitoring.
Pricing: Starts at $1,997. A 14-day free trial is available.
3. Paessler PRTG Network Monitor
Best for: IT teams that want to know when a device or link slows down or stops responding.
PRTG uses sensors to monitor individual parts of a device or service. One sensor can track interface traffic, while another can check whether a device responds. The results give your team a history to review when a problem occurred earlier.
For example, a team can monitor a branch router's response time and the traffic on its internet connection. If users report a slow connection, the team can check whether the link was busy or the router stopped responding at the same time.
PRTG works well when you need ongoing monitoring, alerts, and historical data. Keep the sensor-based licensing model in mind because several checks on one device can use several sensors.
Pros
- The Free plan supports up to 100 sensors.
- Saved history helps investigate problems after they end.
- Uptime, response time, and traffic data provide more detail than a basic status check.
Cons
- Every monitoring check uses a sensor.
- You may still need packet capture for detailed connection troubleshooting.
Pricing: The Free plan supports up to 100 sensors. The PRTG 500 plan starts at $200 per month, billed annually.
4. ManageEngine OpUtils
Best for: Network administrators who need to find a device and switch port from an IP address.
ManageEngine OpUtils combines IP address management, switch port mapping, device discovery, and network utilities.
If you have an IP address but do not know which device is using it, OpUtils can help trace the address to the device and switch port. Its diagnostic tools also include ping, port scanning, DNS utilities, and other network checks.
For example, if an unfamiliar device appears on a subnet, an engineer can identify the IP address, find the related device and switch port, and run a connectivity test.
Pros
- Helps trace an IP address to a device and switch port.
- Combines IP management and network utilities.
- Offers a free edition for smaller networks.
Cons
- The free edition has limits on network ranges and switches.
- It does not provide packet-level inspection.
Pricing: A free plan is available. Paid plans start at $345 for 250 IP addresses and switch ports.
5. Datadog Network Monitoring
Best for: Cloud teams already using Datadog to monitor hosts and applications.
Datadog provides separate capabilities for cloud network traffic, network devices, and network path tests. Cloud Network Monitoring shows traffic between hosts, services, and containers.
Network Device Monitoring checks routers, switches, and firewalls. Network Path tests routes and shows latency and packet loss.
For example, if one service has trouble reaching another, your team can first check the traffic between the two systems. A path test can then show whether the route changed or where packet loss or delay appeared.
Teams already using Datadog can add network monitoring to their existing infrastructure and application monitoring setup.
Pros
- Network, host, and application data can be viewed together.
- Supports cloud and physical network monitoring.
- Network Path helps investigate route and packet-loss problems.
Cons
- Different network capabilities have separate costs.
- Cloud Network Monitoring also requires an Infrastructure plan.
Pricing: Cloud Network Monitoring starts at $5 per network host per month, billed annually. Infrastructure Pro starts at $15 per host per month, billed annually.
6. PingPlotter
Best for: IT teams investigating connection drops or slowdowns that happen at random times.
PingPlotter repeatedly checks the route to a destination and records latency and packet loss over time. Its graphs show when a slowdown or outage started and whether it affected a particular point along the route.
For example, if a hosted application becomes unreachable for a few minutes every afternoon, PingPlotter can keep testing the route during that period. Your team can then review the saved results after the connection returns to normal.
PingPlotter Cloud also supports agents in different locations, which helps determine whether an issue affects one office or several locations.
Pros
- Useful for intermittent connection problems.
- Saved graphs show what happened after an outage ends.
- Cloud agents can help compare different locations.
Cons
- The free version has limited history.
- It does not inspect packet contents or provide detailed device health data.
Pricing: The Free plan supports one connection with limited history. Standard starts at $6.99 per month.
7. Cisco ThousandEyes
Best for: Comparing internet and cloud service performance across different locations.
Cisco ThousandEyes runs network and application tests from different locations. Cloud Agents test from locations on the internet, Enterprise Agents can run from locations within your environment, and Endpoint monitoring can show network conditions on an employee's device.
For example, if a SaaS application works from one office but is slow from another, ThousandEyes can compare the paths from both locations. Your team can then see where the delay begins and whether the issue is related to the local network, internet path, DNS, or the application.
ThousandEyes is useful for problems that cross the internet, multiple offices, or different network providers.
Pros
- Helps compare service performance across locations.
- Combines network, application, DNS, and endpoint testing.
- Useful for internet and cloud connectivity problems.
Cons
- Pricing is available by quote.
- Cost depends on the number, type, and frequency of tests.
Pricing: Custom annual subscription.
8. Wireshark
Best for: Engineers who need to inspect exactly what two systems sent to each other.
Wireshark captures network packets and lets engineers inspect the traffic in detail. You can check whether a connection opened, whether a request was sent, whether a response came back, and where the exchange stopped.
For example, a server may respond to ping while an application connection still fails. A packet capture can show whether the application request reached the server and whether the server responded.
Wireshark only shows traffic available at the point where you capture it. If the problem occurs somewhere else in the network, you may need to capture traffic from another location. It is designed for detailed investigation rather than continuous monitoring.
Pros
- Provides detailed packet-level information.
- Free to use.
- Filters make large captures easier to investigate.
- Saved captures can be shared with other engineers.
Cons
- You need to capture traffic from the right point in the network.
- It does not continuously monitor connections or send alerts.
Pricing: Free.
What Should a Network Diagnostic Tool Help You Check?
Choose the checks that match the faults your team handles. A long feature list does not help if the tool cannot see the part of the network where your problems occur.
Device and service reachability: Check whether a device responds and whether the expected service port is open. Ping and port scans answer different questions.
Route and packet loss: Follow the path between the starting point and the device or service you are trying to reach. Repeated checks can show when a route changes or a connection drops.
Traffic use: Check which interface is busy and, if needed, which sources or applications are using the link.
Packet details: Capture traffic when you need to see the requests and replies exchanged by two systems.
Link throughput: Test between two points you control when you need to measure how much data a connection can move.
History and alerts: Keep results over time when a problem comes and goes or affects users before an engineer is watching.
Test locations: Run tests from the office, cloud location, or employee device that actually experiences the fault. A test from headquarters may miss a problem at a branch.
How to Choose the Right Network Diagnostic Tool
Start with the problem: Identify the specific network issue you need to investigate, such as a device that is unreachable, a slow connection, packet loss, or an application that will not connect.
Define what you need to find: Decide whether you need to check reachability, trace a network path, inspect traffic, measure link performance, or monitor a problem over time.
Choose the right test location: Run the test from the same location where the problem occurs. If the issue affects users in different offices or locations, make sure your testing covers those locations.
Check the access requirements: Make sure you can access the devices, interfaces, network paths, or traffic required for the investigation.
Decide whether you need a one-time test or ongoing monitoring: Use a one-time test when the problem can be investigated while it is happening. Choose ongoing monitoring when the issue is intermittent or may disappear before your team can investigate it.
Consider who needs the results: Decide whether the results are for one engineer or need to be shared across a network or IT team. Consider whether you need shared dashboards, historical data, reports, or alerts.
Review the pricing model: Check what the product charges for and which features or usage levels are included in each plan.
Test your actual requirements: During a trial, use the devices, locations, tests, and monitoring frequency your team expects to use. This gives you a clearer idea of whether the tool meets your requirements and what it will cost.
Conclusion
The right network monitoring tool depends on what you need to monitor and troubleshoot.
If you want one platform to keep track of devices, traffic, routes, and overall network performance, Motadata ObserveOps is a good option to consider.
It gives your team a central place to monitor network health and investigate issues when they occur. If you want to see how it works with your network, you can book a demo and explore the platform with your team.
FAQs
What is the best free network diagnostic tool?
There is no single free tool for every problem. Use Wireshark to inspect packets, Nmap to check devices and ports, or iperf3 to measure a link between two computers. PRTG and OpUtils have limited free editions if you need regular checks.
Which tool can show where packet loss starts?
PingPlotter, Datadog Network Path, Motadata ObserveOps, and ThousandEyes can show loss along a network path. Check the final destination too. A router on the route may reply slowly to the test even when it still passes normal traffic without a problem.
Is Wireshark enough to diagnose every network problem?
No. Wireshark shows packets you can capture at one point on the network. It can help explain a failed exchange, but it will not show an outage that happened before you started capturing. For problems that come and go, use a tool that checks the connection over time.
What is the difference between Nmap and a network monitoring tool?
Nmap scans for devices, ports, and services at the time you run it. A network monitoring tool repeatedly checks the devices or paths you select and keeps a history. Use Nmap to check what is reachable now. Use monitoring to learn when a problem started and whether it keeps returning.
How much do network diagnostic tools cost?
Wireshark, iperf3, and Nmap for internal use have no software license fee. Paid tools charge in different ways. The PRTG 500 plan starts at $200 per month, paid annually, while the PingPlotter Standard plan starts at $6.99 per month. Before comparing paid tools, work out how many sensors, devices, hosts, or tests your team will actually use.
Author
Poonam Lalani
Content Strategist
Poonam Lalani is a B2B content strategist and writer with a background in computer engineering and experience across enterprise technology domains, including AI, cloud, DevOps, data engineering, and IT operations. She specializes in creating research-driven content that simplifies complex ideas and supports product education, thought leadership, and business growth.