Top Network Monitoring Statistics for 2027 That Justify Uptime Spend
Is your network monitoring budget request held up by figures from 2022? Finance reviewers click through to the source behind each number. Point that click at a vendor blog or a withdrawn study and the request comes back with questions.
A regional retailer loses its checkout network for forty minutes during a weekend sale. Card terminals stop, queues build, and the IT director now has to put a price on better observability; the only downtime figures in the shared drive are a decade-old analyst estimate and two vendor blog posts. Neither will survive a CFO's review.
This page started as a rebuild: every figure we could not trace to its publisher came out. What remains are network monitoring statistics for 2027, each with a link to the research behind it. You'll get outage costs and causes, the performance limits that match the network performance metrics your engineers already chart, and a four-step business case.
Key Network Monitoring Statistics for 2027
In short, network monitoring statistics put numbers on outages, downtime cost, performance limits and spend. A CIO uses them in two places: target setting and budget reviews. Nothing here is older than 2025, and each source link appears in the section that covers it.
Outage cost: Over $100,000 for 57% of operators' last major outage, and over $1 million for 1 in 5 (Uptime Institute, 2026)
Avoidable outages: Preventable with better management, processes or configuration, said 87% of operators who had one (Uptime Institute, 2026)
Human error: Played some part in the latest impactful outage for 92% of operators (Uptime Institute, 2026)
Top network cause: Network issues still lead IT service disruptions, and failed configuration changes lead network issues (Uptime Institute, 2026)
Breach cost: $4.99 million on average, a record and up 12% (IBM, 2026)
How attackers got in: Exploited vulnerabilities in 31% of breaches, with a third party involved in 48% (Verizon, 2026)
Monthly allowance at 99.9%: Roughly 43 minutes and 48 seconds of downtime before the SLA is breached
Voice delay: Calls start to lag once one-way delay passes about 150 ms (ITU-T G.114)
Switching spend: Up 43.4% in a year, to $18.9 billion in 2Q26, mostly on data center gear (IDC, 2026)
IT budgets: Expected to pass $7 trillion for the first time in 2027, reaching $7.35 trillion, up 15% (Gartner, 2026)
Each of these figures rests on a few basic network measurements. Those come first.
Which Network Statistics Matter Most to IT and Business Leaders?
Network statistics, or network stats, are the readings a network gives about its own health. An engineer reads them to locate a fault. Someone in finance reads the same figures with a different question in mind: can this network carry revenue and keep its contract promises?
Network statistic | What it measures | Why the business cares |
Share of time a device, link or service answers | Decides whether SLA commitments are met | |
Time a packet takes to cross the network | Slows checkout pages and cloud apps | |
Variation in delay between packets | Breaks up voice and video calls | |
Packets that never arrive | Drops calls and forces file transfers to retry | |
Share of a link's capacity in use | Shows when to fund an upgrade before users feel congestion | |
Interface errors and discards | Bad or dropped packets on a switch or router port | Flags a failing cable or card before it fails outright |
Give a statistic a target and a monthly review, and you have a network performance KPI. Most of the data arrives through SNMP polling and flow records, plus synthetic tests that probe a path on a schedule. A network observability platform collects all three and lines them up against each other.
How Much Does Network Downtime Cost in 2027?
Every minute a network, or a service on it, stays unreachable costs money; network downtime cost is the total of those minutes. That covers missed revenue, idle staff and the recovery bill. Recent network downtime statistics express the cost of network downtime as bands from operator surveys (a more useful planning tool than one per-minute average).
Those bands also show where an incident stops being an operational problem and becomes a board-level one.
Outage Cost Bands From the Uptime Institute
Uptime Institute has run its Annual Outage Analysis for eight years, and the 2026 edition came out in May. Of the respondents, 57% said their latest major outage cost more than $100,000. For the second year in a row, one in five put that cost above $1 million.
That makes six figures the typical price of a major incident. Uptime's findings on frequency, severity and duration:
Frequency: Down to 50% of operators reporting an impactful outage in three years, the lowest since 2020
Severity: About 1 in 10 last outages rated serious or severe
Duration: More public outages ran past 48 hours, for the second year running; 55% were fixed within 12 hours
A short branch outage and a day-long data center failure land in very different network downtime bands. To turn the bands into a figure for your own environment, our guide to the cost of downtime walks through a formula you can apply to your revenue and staffing numbers.
Breach Costs Linked to Detection and Response Speed
Security incidents carry their own downtime and recovery bill. According to IBM's Cost of a Data Breach Report 2026, the average breach now costs $4.99 million worldwide; that is 12% more than a year earlier and the highest figure IBM has recorded.
Detection speed moves that number. IBM found that organizations using AI and automation extensively across security operations paid $1.93 million less per breach than those using none.
Network operations face the same arithmetic. Every hour cut from MTTD, the mean time to detect a problem, is an hour an incident stops adding cost, which leads to the next question of what starts these outages.
What Causes Most Network and Data Center Outages?
Four sources account for most network and data center outages. Power comes first; then network faults, configuration changes and third-party services, with human error mixed into about nine in 10 incidents. Network outage statistics from Uptime Institute's 2026 analysis show how the mix breaks down, using operator surveys and publicly reported incidents.
Power, Procedure and Human Error as Outage Causes
Power is still the leading cause of impactful data center outages. Even so, the share is shrinking. In Uptime's 2025 survey, 45% of operators named power as the primary cause, compared with 54% the year before.
People rarely cause an outage alone, yet 92% of respondents said human error played at least a minor part in their latest impactful one. The most common driver was plain: established procedures were not followed. And 87% thought better management, processes or configuration would have prevented the outage, a seven-point rise in 2024.
Network, Configuration and Third-Party Causes of Outages
Inside IT services, network problems remain the most frequently reported cause of disruption, though the margin over other causes has narrowed. Configuration and change management failures are still the main driver of those network outages, which is why tracking configuration drift matters for availability as much as for compliance.
Uptime Institute's analysis also flagged 3 shifts outside the data center:
Fiber and cable incidents: Top cause of publicly reported IT outages in 2025, running at over twice their long-term average
Third-party providers: Cloud, internet, telecom and colocation firms, behind about two-thirds of the public outages Uptime has tracked over nine years
Cloud risk cover: 18% of operators carry insurance for cloud provider outages
A cut fiber line or a cloud provider fault starts outside your own racks. Those links still need watching. Our network path visibility capability traces each route hop by hop, from the branch router out through the ISP and into the cloud region.
What Do 99% to 99.999% Availability Targets Allow?
An availability target is the share of time a service has to stay reachable. Each extra nine cuts the allowed downtime by 90%. Our math assumes a 365-day year, a 730-hour month and a 168-hour week.
Availability target | Allowed downtime per year | Per month | Per week |
99% | 3.65 days | 7.30 hours | 1.68 hours |
99.9% | 8.76 hours | 43.8 minutes | 10.1 minutes |
99.95% | 4.38 hours | 21.9 minutes | 5.04 minutes |
99.99% | 52.6 minutes | 4.38 minutes | 1.01 minutes |
99.999% | 5.26 minutes | 26.3 seconds | 6.05 seconds |
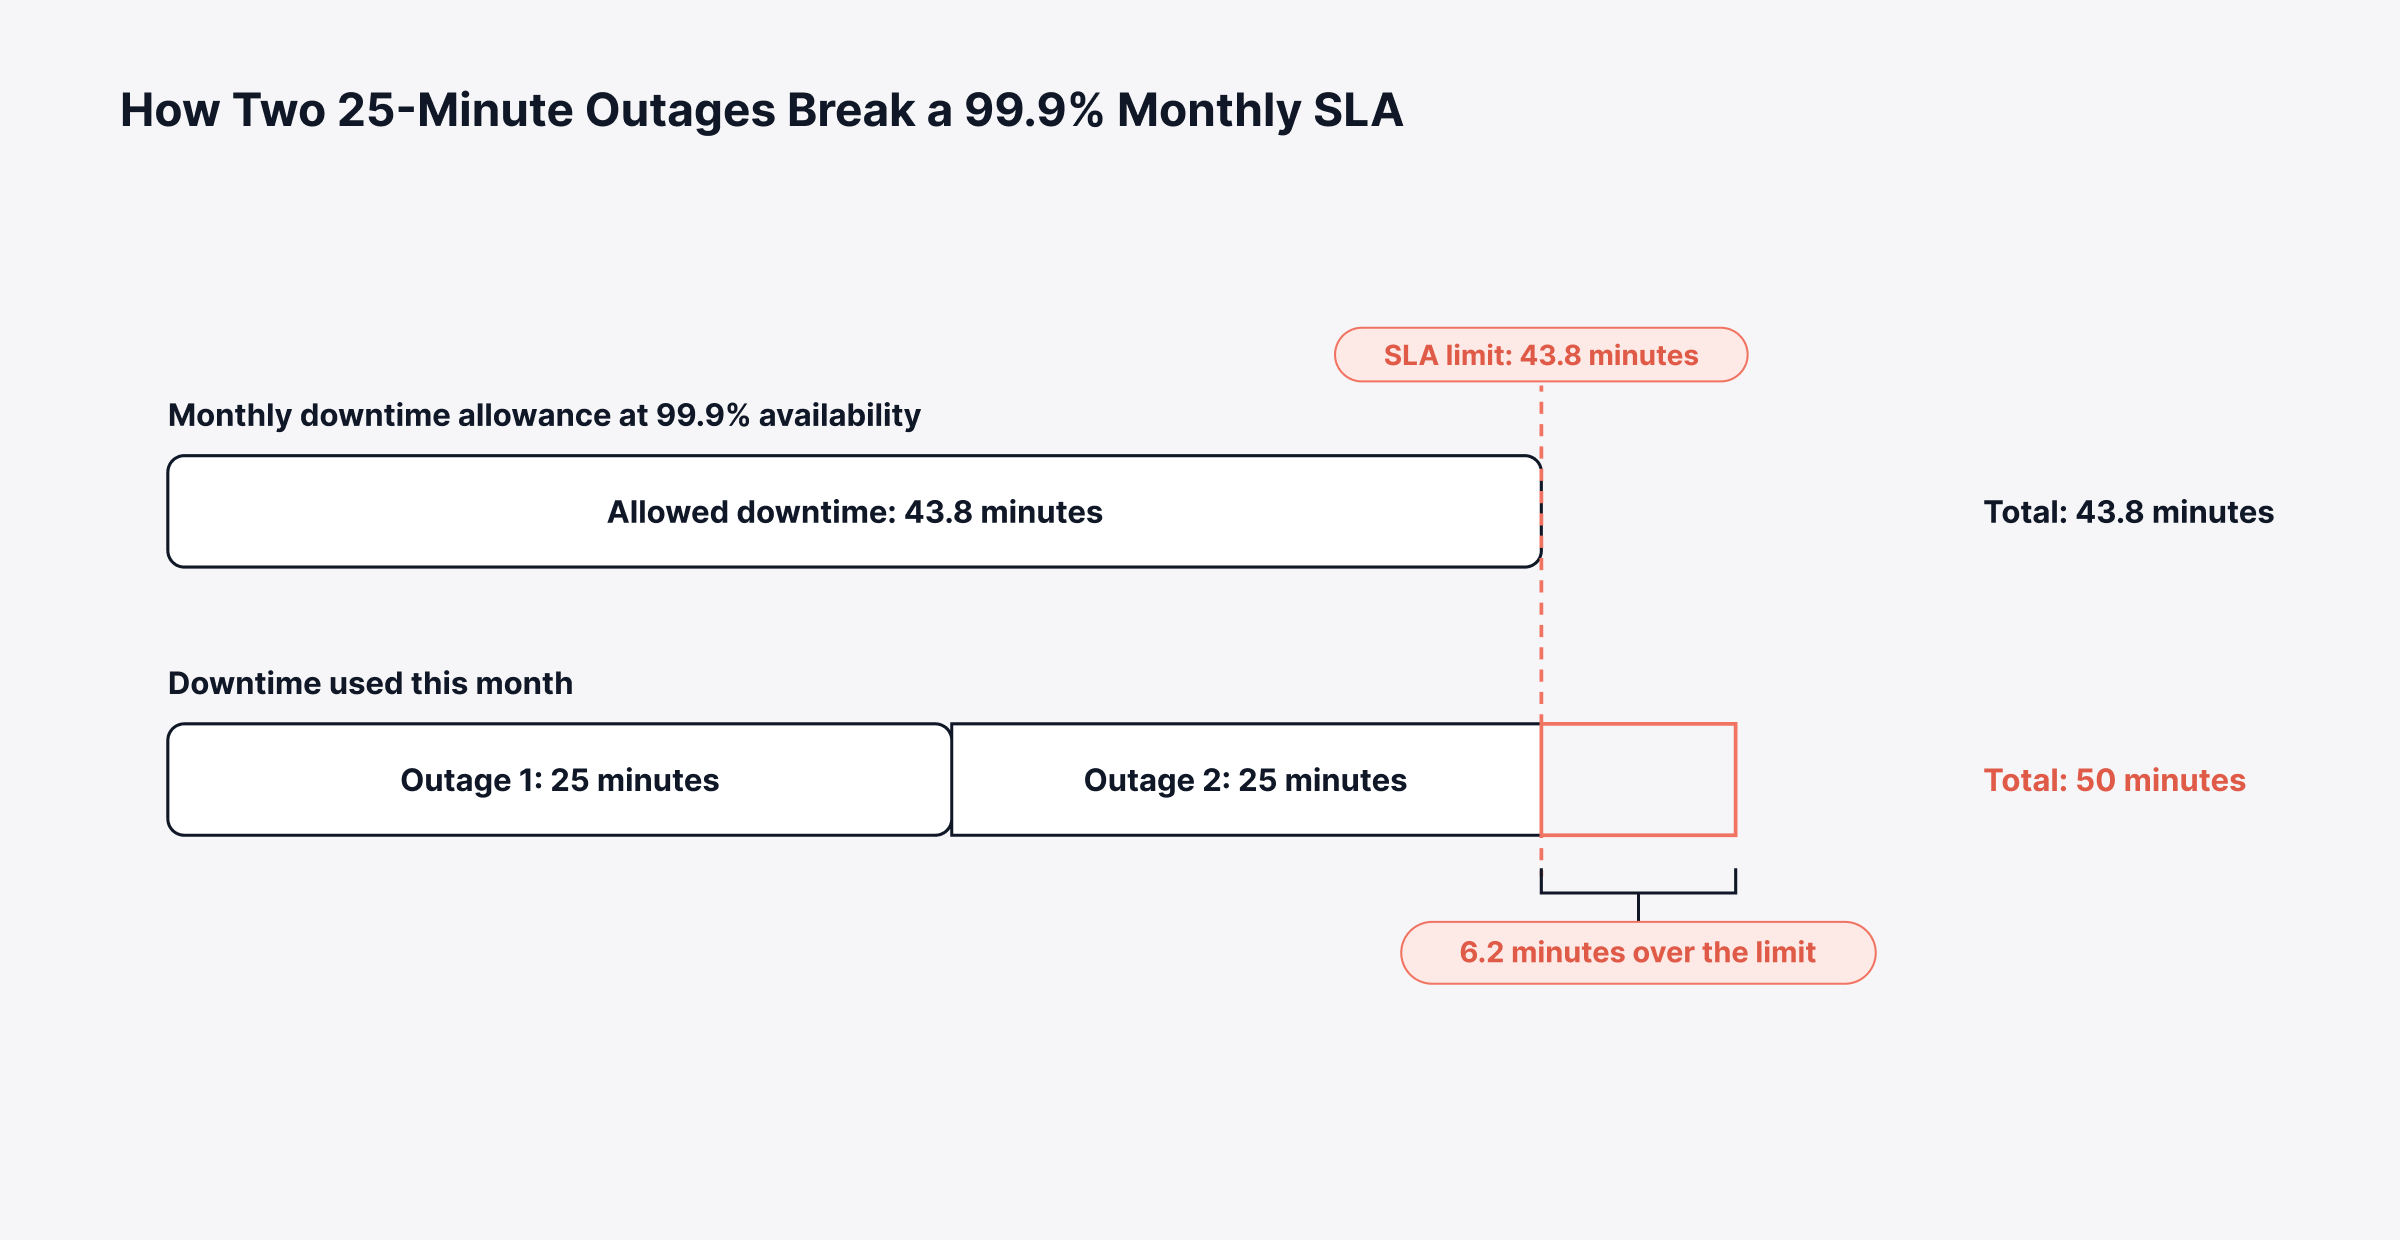
A payments gateway sold with a 99.9% availability promise shows how fast that allowance goes. Early in the month a core router fails and checkout is down for 25 minutes; three weeks later, a bad firmware push costs another 25. That is 50 minutes against a 43.8-minute allowance, enough to trigger the SLA penalty terms in the contract.
Track the minutes left on each SLA as the month goes on; a second incident can use up whatever the first one left. Below, both outages are laid against the 43.8-minute allowance, with the overage marked.
At five nines, the whole year allows about five minutes, and that has to cover outages, failed changes and failovers together. Promise only the target your tooling and engineers can meet. We built uptime assurance into ObserveOps for this: each device, link and service is mapped to its target, with a running view of how much of the month's allowance is gone.
Network Performance Benchmarks for Latency, Jitter and Packet Loss
Network performance benchmarks are the limits for latency, jitter and packet loss that a network path has to stay within. Each type of traffic has its own set. We use international standards here because they state what each traffic type needs, and they stay stable from year to year.
ITU-T Recommendation Y.1541 sorts IP traffic into six QoS classes. The strictest one, Class 0, allows a mean one-way delay of 100 ms. The full set of latency, jitter and packet loss benchmarks is below.
Traffic class | Typical use | Delay limit | Jitter limit | Packet loss limit |
Class 0 | VoIP and video conferencing, highly interactive | 100 ms | 50 ms | 0.1% |
Class 1 | VoIP and video conferencing, interactive | 400 ms | 50 ms | 0.1% |
Class 2 | Transaction data and signaling, highly interactive | 100 ms | Not specified | 0.1% |
Class 3 | Transaction data, interactive | 400 ms | Not specified | 0.1% |
Class 4 | Short transactions, bulk data and video streaming | 1 s | Not specified | 0.1% |
Class 5 | Default IP applications | Not specified | Not specified | Not specified |
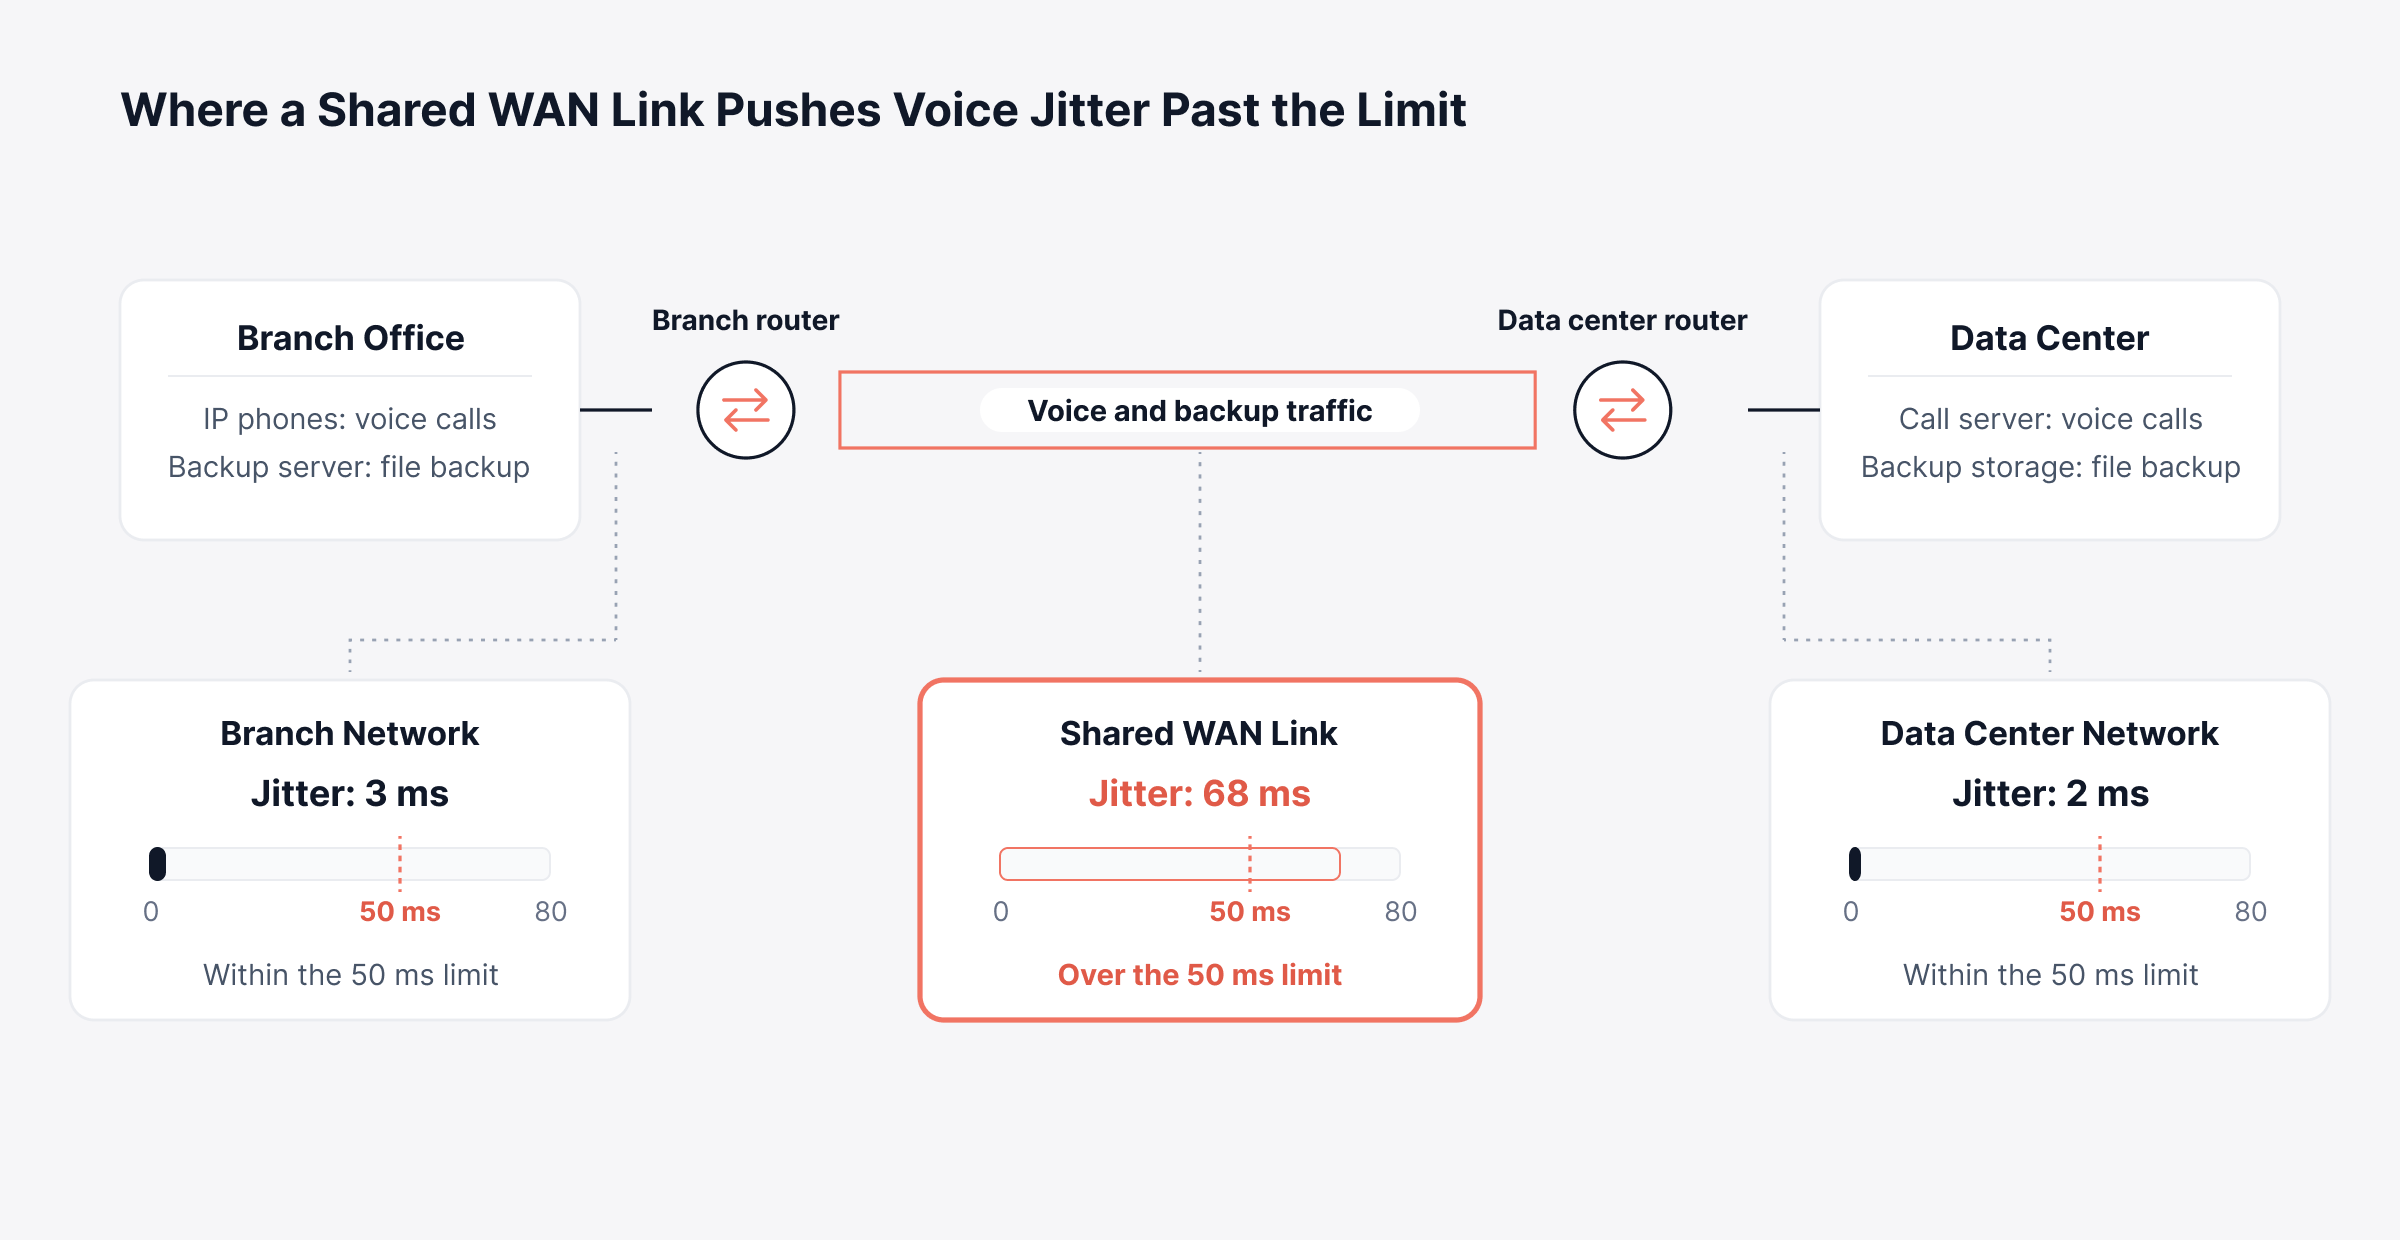
Consider a branch office whose voice calls share a WAN link with scheduled backups. When a backup runs into business hours, jitter on that link can climb past the 50 ms limit and calls break up while the link itself stays up. Measuring latency, jitter and loss per path, the focus of our network performance insight capability, shows which segment broke the limit.
Measure jitter per segment so a breach can be traced to the link that caused it. The path below places each segment's jitter against the 50 ms voice limit.
ITU-T G.114 adds a voice-specific rule on top. Keep one-way delay under about 150 ms and most calls and interactive apps respond without a noticeable lag; for general network planning, the standard puts the ceiling at 400 ms. How to measure that delay is covered in our guide to network latency.
Network Security Statistics That Shape Observability Priorities
Network security statistics answer two questions: how attackers get in, and how long a known weakness stays open. Both tell network operations where visibility matters most. The 2026 Data Breach Investigations Report from Verizon drew on more than 31,000 incidents; over 22,000 of them were confirmed breaches.
In 31% of those breaches, the attacker got in through an exploited vulnerability. The report's other headline figures:
Third parties: Involved in 48% of breaches, up 60% on the prior dataset
Patch delay: 43 days, the median time to fully resolve vulnerabilities on the CISA Known Exploited Vulnerabilities list
Human element: 62% of breaches
Ransomware: 48%, close to half of all breaches
Put in calendar terms, 43 days is about six weeks with a known flaw still open. For leadership, that window is measurable risk, which is why device settings checked against policy through configuration compliance belong in network risk reporting.
Network Infrastructure and IT Spending Statistics
Network spending statistics track what organizations pay for switching, routing and the rest of IT. Estimates of the network monitoring market vary because each research firm defines the category its own way; spending trackers give a steadier read. Our roundup of network monitoring trends covers how those budgets are changing tooling.
Worldwide Ethernet switch revenue came to $18.9 billion in the second quarter of 2026, according to IDC, a 43.4% rise on the year before. AI infrastructure was the main driver, mostly through data center switching. IDC's segment figures for the quarter:
Data center switching: $12.3 billion, up 64.5%
Campus and branch switching: Up 15.7% to $6.6 billion
Routers: $4.5 billion (up 22.8%), of which enterprise routers made up $1.2 billion
Gartner expects worldwide IT spending of $7.35 trillion in 2027. AI infrastructure and software account for much of the 15% increase. Each new switch or link adds interfaces to track, and capacity planning forecasts flag when growth will run into the limits of current hardware.
Network Automation Adoption Statistics
Network automation adoption statistics measure how much routine network work now runs through software. Configuration, troubleshooting and alert handling are the usual starting points. Back in September 2024, Gartner predicted 30% of enterprises would automate over half their network activities by 2026; in mid-2023, fewer than 10% did.
Uptime's 87% avoidable figure points to where automation pays off first: repeatable change and response steps, where errors start. In network operations, that usually means three areas:
Baselining: Learning the normal range of each metric so that anomaly detection flags deviations before a static threshold is crossed
Change control: Backing up device configurations and comparing each new version with an approved baseline
Alert routing: Opening tickets and escalating automatically when an availability target is at risk
How to Build a Network Observability Business Case From These Statistics
Think of a network observability business case as a chain: outage cost, then the availability target, then the visibility gap that makes outages longer or more frequent. These 4 steps turn the figures on this page into a case finance can check:
Set the target: Assign each service its availability target and convert it to allowed minutes with the availability table in this guide
Place outages in a cost band: Compare recent incident durations and impact against the Uptime Institute thresholds of $100,000 and $1 million
Name the cause pattern: Tag past incidents as power, network, configuration change or third-party in origin, then compare the mix with the outage causes covered earlier
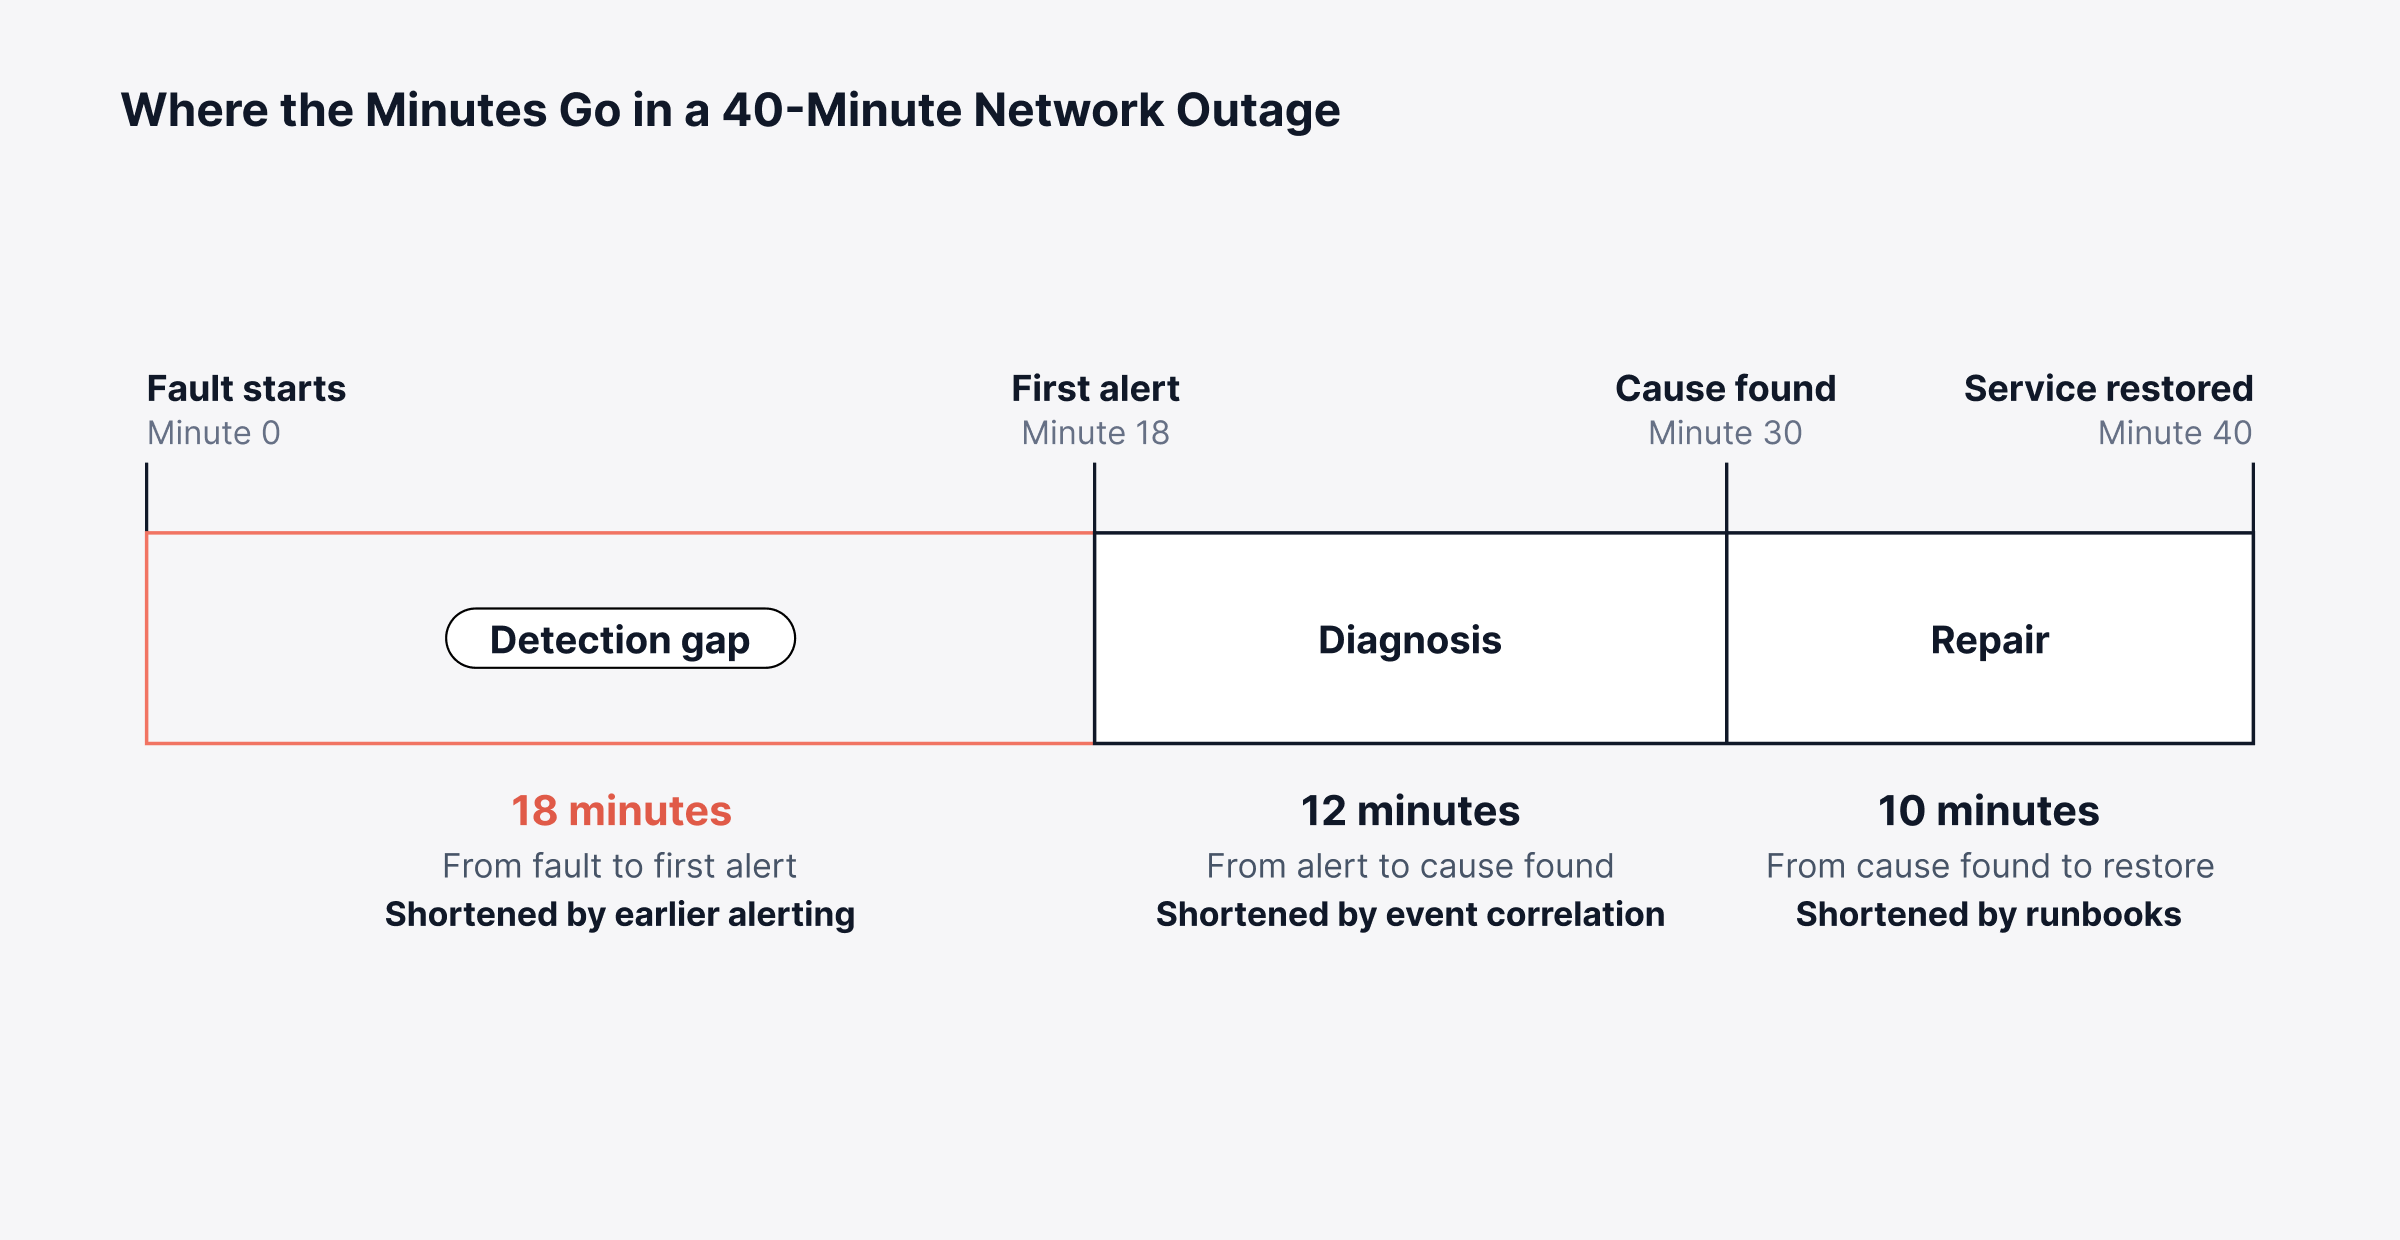
Price the detection gap: Estimate how many minutes passed in each incident before a real-time alert fired, since that time is the part observability can shorten
Split each past incident into detection, diagnosis and repair time before pricing it. The timeline below breaks a 40-minute outage into those three stretches.
Return on the observability tool itself is a separate calculation, which our guide to monitoring ROI covers in detail.
How Motadata Selected and Verified These Statistics
Every statistic here comes straight from the organization that ran the research. All were published within the last three years, and we checked each against its source in October 2026. Three rules shaped the list:
Primary sources only: Outage surveys, breach studies, analyst spending trackers and ITU standards, with no figures taken from articles that cite other articles
Established research series: Annual studies and standards bodies with a published method (product marketing pages were left out)
Dated figures: Publication year shown on every statistic, with a refresh whenever the major reports update
Y.1541 and G.114 are older ITU-T documents. Both are still in force, and networks are still engineered to their thresholds.
Track Outage Risk and Network Performance in One Place With Motadata ObserveOps
Read together, the 2027 numbers point the same way. More often than not a major outage now costs six figures; most involve a process or configuration failure, and many start on infrastructure the organization does not own. No observability platform stops a utility power failure or a cut fiber line, and these figures will move again as new reports land.
What network observability changes is how quickly those events surface and how clearly the cause shows up. We built ObserveOps to put availability and path performance in the same platform as configuration changes and SLA tracking. The minutes that decide an outage's cost band then go into the fix, and the next outage review starts with evidence finance can check.
FAQs
What are the most important network monitoring statistics for 2027?
The most useful figures cover outage cost, outage causes and performance thresholds. Uptime Institute reports that 57% of operators saw their last major outage cost over $100,000, network issues remain the top cause of IT service disruption, and ITU guidance treats 150 ms one-way delay as the limit for comfortable voice calls.
How much does an hour of network downtime cost?
Cost depends on revenue, staffing and how many services an outage touches, so one hourly figure rarely fits every organization. Current operator surveys report cost bands instead. In the latest Uptime Institute research, 57% of operators said their most recent major outage cost more than $100,000, and one in five said it passed $1 million.
What is an acceptable packet loss rate for business networks?
ITU-T Y.1541 sets a packet loss objective of 0.1% for its specified traffic classes, including voice, video conferencing and transaction data. Loss above that level degrades real-time traffic first, so voice and video paths usually need closer monitoring than links carrying bulk data transfers.
How much downtime does a 99.9% SLA allow?
A 99.9% availability target allows about 8.76 hours of downtime per year, or roughly 43.8 minutes per month. Each additional nine cuts that allowance by 90%, so 99.99% leaves about 4.38 minutes per month. Platforms such as Motadata ObserveOps track how much of that allowance each service has already used.
How do network monitoring and observability reduce outage costs?
They shorten the time between a fault and the first alert, and they show which device, path or configuration change caused the problem. Motadata ObserveOps tracks availability against SLA targets and flags performance anomalies early, which helps keep incidents inside a lower cost band.
Author
Poonam Lalani
Content Strategist
Poonam Lalani is a B2B content strategist and writer with a background in computer engineering and experience across enterprise technology domains, including AI, cloud, DevOps, data engineering, and IT operations. She specializes in creating research-driven content that simplifies complex ideas and supports product education, thought leadership, and business growth.