10 Top Network Traffic Analysis Tools for Faster Troubleshooting and Capacity Planning
A request to upgrade a saturated circuit is easy to raise and hard to defend. The interface graph proves the link is full. It says nothing about which application, host or conversation filled it, so the spend gets approved on assumption instead of evidence.
The same missing detail turns up everywhere else. Incidents run long because the cause is guessed at, capacity planning rests on estimates, and security questions arrive weeks after the traffic record expired.
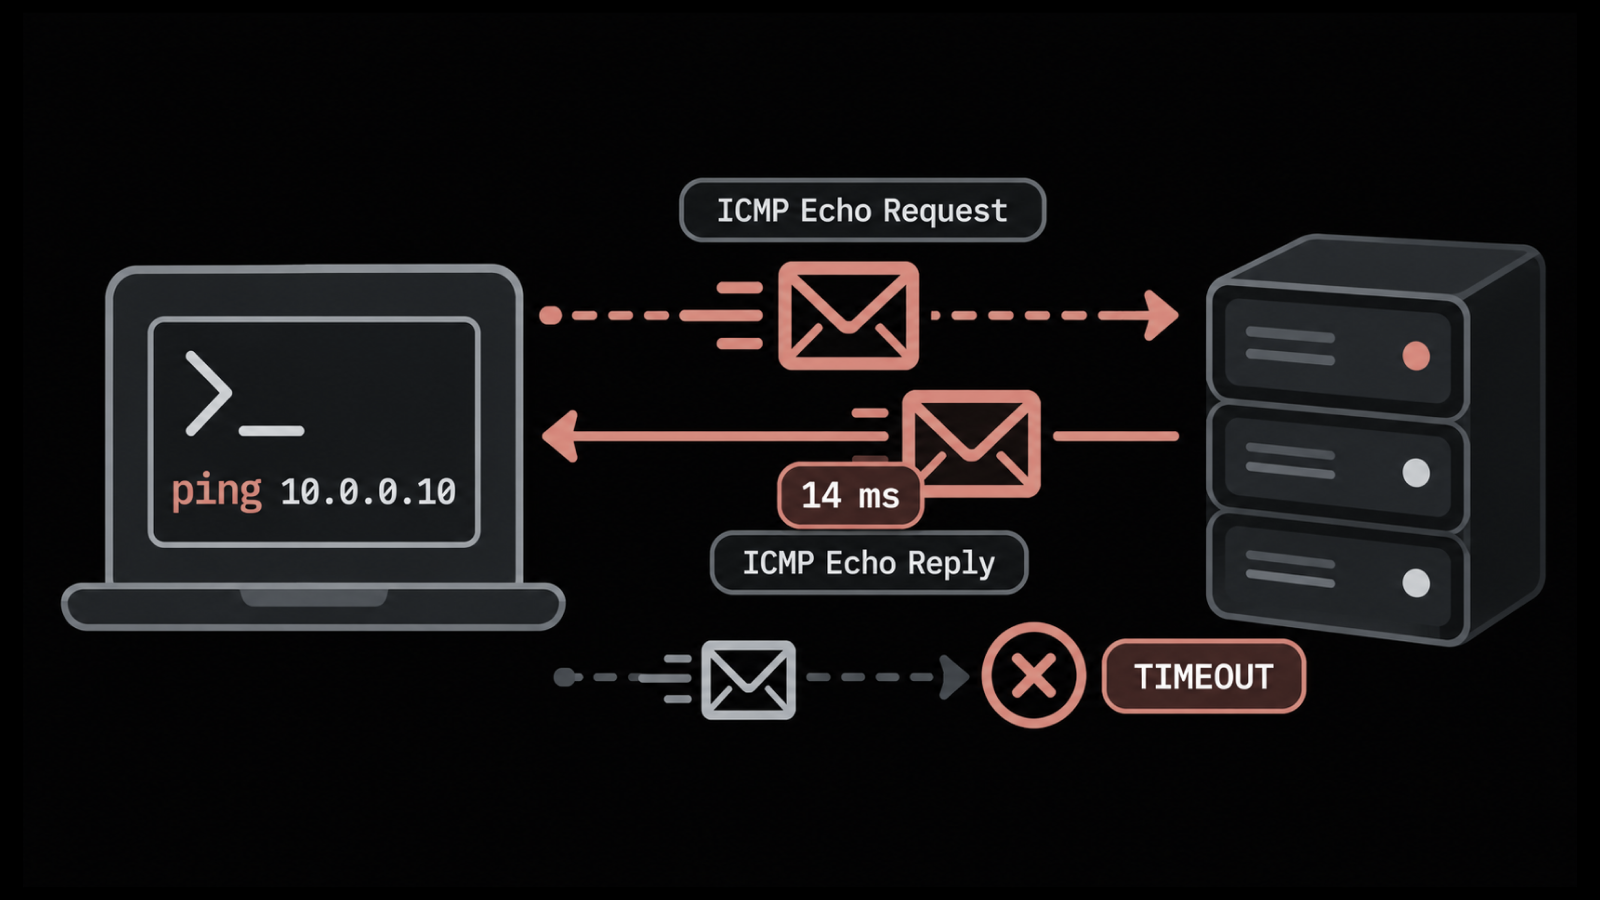
Network traffic analysis tools produce that missing record. They collect flow data from routers, switches and firewalls, or capture packets directly, turning both into a searchable account of every conversation on the network. It is the layer that bandwidth monitoring alone never reaches.
Here is what this guide covers:
Why bandwidth graphs show the symptom while flow and packet data show the cause
The difference between flow analysis and packet capture, and why buying the wrong one wastes budget
Ten tools reviewed with verified pricing, licensing basis and third-party ratings
What each tool actually monitors, so the comparison rests on scope instead of adjectives
When free options are enough, and the three points at which they stop being enough
By the end, you will know which type of tool fits your network, which product fits your budget and deployment rules, and what to ask a vendor before signing.
Our Top Three Picks at a Glance
Network traffic analysis tools fall into three buying situations, and these are the strongest options in each.
Best for consolidating traffic with the rest of your monitoring: Motadata ObserveOps, which analyzes flow alongside metrics, logs and traces in one platform instead of a separate console.
Best for packet-level troubleshooting at no cost: Wireshark, the free network traffic analyzer most engineers already reach for when a specific link needs investigating.
Best for security-led investigation: ExtraHop RevealX, built for teams whose main use of traffic data is proving what a compromised host did.
What Are Network Traffic Analysis Tools?
Network traffic analysis tools collect and interpret data about traffic moving across a network, so teams can see what is consuming bandwidth, how applications behave, and whether any of it looks wrong.
The answer to what is network traffic analysis comes down to a record of conversations. Availability monitoring tells you a link is up. Traffic analysis tells you who talked to whom, how much, over which protocol and when.
Network traffic analysis software falls into three data models, and the split decides what you can and cannot answer later:
Flow records: Metadata exported by routers, switches and firewalls using NetFlow traffic monitoring, sFlow, J-Flow or IPFIX
Packet capture and deep packet inspection: Copies of the traffic itself, giving protocol and payload evidence at a far higher storage cost
Derived metadata: Structured records generated from packets, sitting between the two in depth and volume
The business case rests on three benefits of network traffic analysis: bandwidth spend that can be justified with evidence, incidents that close faster because the cause is measured, and a traffic record that survives long enough to answer an audit.
Flow scales across a whole network cheaply because it summarizes. Packet data answers questions flow cannot and consumes network bandwidth storage fast enough to force hard retention decisions.
How Do Flow Data and Packet Data Differ?
Flow data and packet data differ in what they record: flow describes conversations, packets contain them.
Buying one when the job needed the other is the most common budgeting error in this category. Both models are useful, and the cost difference between them is large.
What Flow Records Answer Well
Flow records identify the source, destination, ports, protocol, byte counts and timing of a conversation.
That covers most operational work:
Top talkers: Which hosts and applications consume the most bandwidth
Circuit sizing: Evidence for renewal decisions instead of estimates
Network traffic pattern analysis: Recurring peaks, backup jobs and shifts in demand over months
Chargeback: Consumption attributed to a site, department or service
Network flow analysis covers an entire routed network from a handful of export points, which is why network traffic flow analysis remains the default for capacity work.
What Packet Data Answers Well
Packet capture gives protocol decodes, inter-packet timing, retransmissions and the contents of unencrypted payloads.
It is the evidence layer when graphs look healthy and an application still fails. Deep packet inspection belongs to the same family, extracting application identity and behavior without storing everything.
The cost is placement and storage. Capture points have to be chosen in advance, and a 10 Gbps link fills disk faster than most retention budgets allow.
Where Sampling Fits
Sampling reduces the volume of exported records by capturing a fraction of traffic at a configured rate.
sFlow samples packets continuously, which keeps overhead predictable at high line rates. NetFlow and IPFIX can also be sampled at the exporter.
Sampling changes what the data means. A 1-in-1000 sample is reliable for traffic volumes, top talkers and packet loss trends, and unreliable for finding a single short-lived connection.
How We Evaluated These Tools
Five factors carried weight in this evaluation, each tied to a cost the business pays.
Telemetry breadth (30%): Flow protocols supported, packet and DPI capability, and whether traffic correlates with other signals
Retention and forensics (20%): How long data stays queryable, since audit and security questions arrive late
Deployment flexibility (20%): SaaS, self-hosted and multi-site options, which decide viability under data residency rules
Operational fit (20%): Alert quality, ticketing integration and how many engineering hours the tool removes
Cost transparency (10%): Whether pricing is published, the licensing unit, and how the bill behaves as the network grows
Deployment weighting reflects a hard constraint rather than a preference, since the choice between on-premise vs SaaS removes several products from consideration entirely in regulated sectors.
What we did not test: we ran no production packet captures at line rate and benchmarked no ingestion under load. Pricing was read from each vendor's live pricing table in September 2026. Ratings come from G2, Gartner Peer Insights and Capterra on the same date.
Network Traffic Analysis Tools Compared at a Glance
The table below sets each tool against the same six criteria, with scope stated narrowly, so the comparison rests on coverage instead of adjectives.
Tool | Best For | Data Model | Deployment | What It Monitors | Pricing | G2 Rating |
Motadata ObserveOps | Consolidating traffic with metrics, logs and traces | Flow plus metrics, logs and traces | Self-hosted, distributed, multi-site, HA | Network flow, devices, servers, applications, cloud, containers, user experience | Quote based | 4.7/5 |
ManageEngine NetFlow Analyzer | Dedicated flow analysis in mid-sized networks | Flow plus DPI add-on | Self-hosted | Network flow, bandwidth, applications, QoS | From $245 per year | 4.6/5 |
SolarWinds NetFlow Traffic Analyzer | Flow inside an existing Orion deployment | Flow | Self-hosted | Network flow and bandwidth | Quote based | Not listed |
Kentik | Hybrid and multicloud traffic at scale | Flow plus synthetics and routing | SaaS | Network flow, cloud flow logs, BGP, synthetic tests, devices | From $2,000 per month | 4.8/5 |
ExtraHop RevealX | Security-led traffic investigation | Packet and wire data | SaaS and self-hosted sensors | Network transaction, protocol behavior, threats | Quote based | 4.6/5 |
Progress WhatsUp Gold | Network monitoring and flow in one console | Flow plus device monitoring | Self-hosted | Network flow, devices, servers, wireless, cloud | Quote based | 4.4/5 |
Paessler PRTG | Small and mid-sized networks | Flow, packet sniffing and SNMP | Self-hosted and hosted | Network flow, bandwidth, devices, servers, applications | From $200 per month | 4.7/5 |
Datadog | Traffic inside a cloud-native platform | Flow-derived network telemetry | SaaS | Cloud and container network paths, infrastructure, applications, logs | $5 per host per month, plus infrastructure license | 4.4/5 |
Wireshark | Packet-level troubleshooting | Packet capture | Desktop | Whatever you capture, on the interface you capture it | Free | 4.7/5 |
ntopng | Open-source continuous flow visibility | Flow plus packet | Self-hosted | Network flow, hosts, protocols | Free, paid from €299.95 | 4.8/5 |
The 10 Top Network Traffic Analysis Tools
Each review below covers what the tool does, the trade-off that comes with it, verified pricing and third-party ratings.
1. Motadata ObserveOps
Best for: Teams that want traffic analysis in the same platform as their metrics, logs and traces
Rating:
G2 - 4.7/5
Gartner Peer Insights - 4.6/5
Capterra - 4.7/5
This is our own platform, so read the considerations below accordingly. ObserveOps ingests NetFlow, sFlow, jFlow and IPFIX alongside device metrics, logs, traces and topology.
Flow Explorer renders traffic as Sankey diagrams, so a bandwidth question becomes a visual trace from source to destination. Because flow shares a data store with other signals, a spike follows through to the device metric and the log line without an export.
The design assumption is consolidation. Where traffic analysis already works well and nothing else needs attention, a dedicated flow analyzer costs less.
Pros
- Traffic questions answered against device and log evidence without switching consoles
- On-premises, distributed and multi-site deployment suit regulated environments and data residency rules
- Alerts can trigger runbooks or open tickets through ServiceNow, Jira or Motadata ServiceOps
- Coverage extends beyond traffic to servers, cloud, virtualization, containers and application traces
Cons
- Pricing is quote based rather than a published rate card, so budgeting starts with a conversation
- The value case rests on consolidation, so flow-only buyers will not use most of the platform
- Deployment mode is a decision to make up front, and changing it later takes planning
- Breadth means longer onboarding than a single-purpose flow analyzer
Pricing:
Licensing: Quote based, scoped to the environment and chosen deployment mode
Trial: 30-day free trial available
2. ManageEngine NetFlow Analyzer
Best for: Dedicated flow analysis in mid-sized networks with published pricing
Rating:
G2 - 4.6/5
Gartner Peer Insights - 4.5/5
Capterra - 4.5/5
NetFlow Analyzer is the netflow traffic analysis tool most shortlists start with. It publishes prices, runs standalone on Windows or Linux, and supports NetFlow, sFlow, IPFIX, J-Flow and NetStream.
The licensing unit is the interface, not the device. One core switch can consume dozens of interface licenses, and wireless controller access points count as interfaces too.
Feature gating matters here. Deep packet inspection and high-performance collection are priced add-ons, so the cheapest tier may not cover the job.
Pros
- Published price list makes budgeting possible before contacting sales
- Runs standalone, with no prerequisite monitoring platform
- Strong reporting depth for capacity planning and chargeback
- Fits neatly for teams already using other ManageEngine products
Cons
- Per-interface licensing grows quickly in switch-heavy networks
- DPI, high-performance collection and IP SLA monitoring are separately priced add-ons
- Editions gate features, so upgrades are common after the first year
- Reporting over long date ranges slows noticeably in large deployments
Pricing: Annual subscription with maintenance included, per interface.
Professional: From $245 per year for 10 interfaces and 2 users, up to $10,395 for 1,000 interfaces
Enterprise: From $445 per year for 10 interfaces, up to $15,595 for 1,000 interfaces
Standard: From $3,438 per year, starting at 500 interfaces
Add-ons: DPI from $38 per agent, failover from $1,915, priced separately
Discount: 20 percent for existing OpManager customers
Trial: Free trial available, plus a free edition for 2 interfaces
See our ManageEngine pricing breakdown for the wider product range
3. SolarWinds NetFlow Traffic Analyzer
Best for: Adding flow analysis to an existing SolarWinds Orion deployment
Rating:
Capterra - 4.6/5
NetFlow Traffic Analyzer is an Orion module rather than a standalone product. It collects NetFlow v5 and v9, NBAR2, J-Flow, sFlow, IPFIX and Huawei NetStream, presenting traffic by application, protocol, endpoint and conversation.
The dependency decides the cost. NTA requires Network Performance Monitor first, the exporting devices must already be monitored by NPM, and the NTA license tier has to match the NPM tier.
SolarWinds has retired perpetual licensing on this line and moved to subscription. The same capability now also appears inside its self-hosted observability product, so confirm which one a quote covers.
Pros
- Mature product with deep reporting and a large installed base
- Fits environments already standardized on Orion
- Handles very large device counts in enterprise deployments
- Multi-vendor flow support covers mixed hardware well
Cons
- Cannot be deployed without Network Performance Monitor
- License tier must match the NPM tier, so scaling costs compound
- Perpetual licensing has been withdrawn in favor of subscription
- No published pricing, and no G2 or Gartner Peer Insights listing to check
Pricing: Quote based, subscription only.
NetFlow Traffic Analyzer: No published rate card, quoted by SolarWinds sales
Prerequisite: Network Performance Monitor licensed at a matching tier
Adjacent published rate: Self-hosted observability from $8 per node per month, multi-year subscription billed annually
Trial: Free trial available
Teams weighing the move can compare options in our SolarWinds alternatives guide
4. Kentik
Best for: Hybrid and multicloud traffic analysis at service provider scale
Rating:
G2 - 4.8/5
Gartner Peer Insights - 4.9/5
Capterra - 4.6/5
Kentik ingests very large volumes of flow and keeps it queryable fast. It combines physical network flow, cloud flow logs from AWS, Google Cloud, Azure and OCI, BGP routing data, synthetic tests and device metrics.
Kentik was acquired by Infoblox in August 2026, and the platform continues to be sold under the Kentik name.
Capacity is metered in flows per second rather than devices. The Pro tier includes 1,000 FPS before add-ons, so an accurate estimate matters before the first sales conversation.
Pros
- Treats hybrid and multicloud traffic as one view instead of separate tools
- Query performance across large historical windows is a genuine differentiator
- Published entry pricing, which is unusual at this end of the market
- Strong fit for service providers, peering and transit cost optimization
Cons
- Entry pricing starts high for mid-sized enterprises
- Annual contracts only, with no monthly option
- SaaS only, which rules it out where traffic data must stay on-premises
- FPS-based metering makes cost forecasting harder than per-device licensing
Pricing: Annual contracts only, billed annually.
Pro: From $2,000 per month, stated by the vendor as $24,000 per year, including 1,000 FPS, 25 devices and 50 users
Premier: Quote based
Regional note: US pricing, with international rates on request
Trial: Free for 30 days
5. ExtraHop RevealX
Best for: Security teams that need transaction-level evidence from network traffic
Rating:
G2 - 4.6/5
Gartner Peer Insights - 4.7/5
RevealX approaches traffic from the security side. It reconstructs transactions from wire data across layers 2 to 7, decodes protocol behavior, and applies machine learning to flag deviation from a baseline.
That depth sets the price. Sensors are sized to the throughput they inspect, so cost scales with how much of the network you cover.
For circuit sizing or chargeback, this is more capability than the job needs. For malicious network traffic analysis, it is the category that answers the question.
Pros
- Transaction-level evidence that flow-based tools cannot produce
- Detection quality is consistently well rated by security practitioners
- Sensors available for on-premises, cloud and hybrid placement
- Asset discovery works from traffic alone, with no agent deployment
Cons
- No published pricing, so evaluation begins with a sales conversation
- Sensor sizing makes broad coverage expensive quickly
- Oriented to security outcomes over capacity planning or billing
- No Capterra listing, which limits independent rating cross-checks
Pricing: Quote based, with no published rate card.
Licensing basis: Sensors sized by inspected throughput
Alternative route: Listings available through AWS Marketplace
Trial: Free trial available
Verification note: No list price could be confirmed on the vendor's own site, and none has been estimated here
6. Progress WhatsUp Gold
Best for: Running network monitoring and traffic analysis from one console
Rating:
G2 - 4.4/5
Gartner Peer Insights - 4.5/5
Capterra - 4.5/5
WhatsUp Gold combines device monitoring with flow analysis in a single installation. Layer 2 and layer 3 discovery builds a map automatically, and traffic analysis attaches to that map.
Licensing takes two shapes. Premium is priced by monitored device, Total Plus by points covering a broader feature set, and traffic analysis influences which route you take.
Perpetual and subscription are both offered, each including the first year of support. Perpetual buyers need an active support agreement to keep receiving updates.
Pros
- Map-driven interface makes traffic investigation quick to follow
- One product covers availability, performance and traffic
- Perpetual licensing remains available, which many vendors have dropped
- Approachable for teams without dedicated network monitoring specialists
Cons
- No published pricing, so every evaluation starts with a quote
- Two licensing models add complexity to the buying decision
- Advanced capability arrives through add-ons that raise the total
- Performance slows in very large deployments, according to user reviews
Pricing: Quote based, with no published rate card.
Premium: Licensed per monitored device
Total Plus: Licensed by points, covering the broader feature set
License types: Perpetual or subscription, each including the first year of support
Trial: Free trial available
Structure is broken down further in our WhatsUp Gold pricing guide
7. Paessler PRTG
Best for: Small and mid-sized networks that want traffic analysis without a separate product
Rating:
G2 - 4.7/5
Gartner Peer Insights - 4.5/5
Capterra - 4.6/5
PRTG handles traffic through sensors: flow sensors for NetFlow, sFlow, jFlow and IPFIX, packet sniffer sensors for direct inspection, and SNMP sensors for interface counters.
The sensor model is also a constraint. Each measured value consumes a sensor, so a few flow sources with several breakdowns each spend the allowance faster than a device count suggests.
Paessler moved from perpetual to subscription in 2024, and a license key applies to one server. Beyond roughly 1,000 devices, buyers are directed to the enterprise product.
Pros
- Published pricing at every tier, with a clear upgrade path
- One installation covers traffic, availability and performance
- Free tier of 100 sensors is usable for small networks
- Quick to deploy, with auto-discovery handling most of the setup
Cons
- Sensor counting is hard to estimate accurately before deployment
- Licenses cannot be pooled across multiple servers
- Perpetual licensing has been retired
- Larger networks are pushed toward a different product entirely
Pricing: Subscription, paid annually, priced per sensor.
PRTG 500: $200 per month for 500 sensors, roughly 50 devices
PRTG 10000: $1,642 per month for roughly 1,000 devices
Free tier: 100 sensors, no time limit
Trial: 30 days with no sensor limit
Tier-by-tier detail appears in our PRTG pricing breakdown, and comparable products in our PRTG alternatives guide
8. Datadog
Best for: Traffic visibility inside cloud-native and containerized environments
Rating:
G2 - 4.4/5
Gartner Peer Insights - 4.7/5
Capterra - 4.6/5
Datadog approaches traffic from the workload rather than the switch. It maps dependencies and paths between services, containers, availability zones and cloud regions using agent-collected data.
The capability was previously marketed as Network Performance Monitoring and now appears as Cloud Network Monitoring, so older comparisons use a different name for the same product.
Model the pricing carefully. Network monitoring requires an Infrastructure Pro or Enterprise license on every host it watches, so the per-host figure is additive.
Pros
- Strong visibility into container traffic that never crosses managed hardware
- Traffic data appears alongside application and infrastructure telemetry
- Published per-host pricing across every module
- Fast to enable where the agent is already deployed
Cons
- Requires an infrastructure license on every host, so network cost is never standalone
- Agent-based collection leaves unmonitored network hardware invisible
- Modular pricing compounds quickly as capabilities are switched on
- SaaS only, which rules it out where data residency requires self-hosting
Pricing: Per host, per month, billed annually unless stated.
Cloud Network Monitoring: $5 per host per month, requiring an infrastructure license on the same hosts
Infrastructure Pro: $15 per host per month billed annually, $18 on demand
Infrastructure Enterprise: $23 per host per month billed annually, $27 on demand
Free tier: 5 hosts with one-day retention
Module stacking is covered in our Datadog pricing analysis
9. Wireshark
Best for: Packet-level troubleshooting and protocol forensics
Rating:
G2 - 4.7/5
Capterra - 4.6/5
Wireshark has been the reference implementation of packet analysis for two decades. It decodes hundreds of protocols, filters captures precisely enough to isolate a single retransmission, and reads capture files from most other tools.
It is not a monitoring platform. There is no continuous collection, no alerting, no retention policy and no dashboard.
That makes it complementary to everything else here. Most engineers running a flow platform still open Wireshark several times a month.
Pros
- Free and open source under GPLv2, with no licensing to manage
- Unmatched protocol depth for diagnosing low-level faults
- Reads capture formats from most commercial tools
- Large community knowledge base for interpreting results
Cons
- No continuous monitoring, alerting or historical trending
- Requires a skilled operator to interpret output usefully
- Capture placement must be decided in advance, one interface at a time
- Large captures become unwieldy on a workstation
Pricing: Free and open source.
License: GPLv2, with no paid edition or vendor support tier
Cost basis: Analyst time and the capture infrastructure it runs on
10. ntopng
Best for: Continuous open-source traffic visibility on a modest budget
Rating:
G2 - 4.8/5
ntopng fills the gap Wireshark leaves. It runs continuously, builds a live picture of hosts, protocols and conversations, and retains history, which makes it the closest network traffic analysis open source option to a commercial platform.
Paired with nProbe it collects NetFlow and IPFIX from network hardware. Commercial editions add SNMP support, alerting depth, historical exploration and user-to-traffic correlation.
The trade-off is operational. Tuning is manual, and support beyond the maintenance year is bought per ticket.
Pros
- Community edition is fully functional for small networks
- Commercial licenses are perpetual, with no subscription requirement
- Very low hardware requirements relative to commercial platforms
- Free for universities, non-profit and research organizations
Cons
- Requires Linux and networking competence to deploy and tune well
- Support is bought per ticket after the included maintenance year
- Interface and reporting are functional, with little polish
- Prices are published only in euros, so cost moves with exchange rates
Pricing: Perpetual licenses per server, each including one year of maintenance.
Community: Free, with network traffic analysis tools free of any license requirement
Pro: €299.95
Enterprise M: €699.95
Enterprise L: €899.95
Enterprise XL: €1,499.95
Enterprise L Bundle: €1,299.95, adding nProbe Pro and n2disk
Support: €129.95 per ticket after the maintenance year
Do You Really Need a Dedicated Network Traffic Analysis Tool?
Not always, and the answer depends on scale, vendor mix and how long you need the record to last.
A single site, one vendor's hardware and an engineer comfortable at the command line will get a long way on router flow exports plus Wireshark. That combination costs nothing.
Three conditions change the calculation:
Retention: Free tooling keeps very little history, and the question that arrives three weeks later cannot be answered from data you no longer have
Correlation across sites and vendors: One collector per site works until a conversation has to be traced across two locations and three vendors' equipment
Where the alert ends: Free tools produce charts, and somebody still has to notice the chart, decide it matters and raise a ticket
The cost of staying free is engineering hours and audit exposure instead of license fees. Many of the network monitoring challenges teams report come from exactly this point, where free tooling stops scaling and nobody has budgeted for what follows.
What Should You Look for in a Network Traffic Analysis Tool?
The right network traffic analyzer software is decided by six criteria, each of which carries a direct cost if it is wrong.
Flow protocol coverage: Confirm NetFlow, sFlow, IPFIX and J-Flow support explicitly, since mixed-vendor networks export more than one format
Licensing unit: Per interface, per device, per host, per flow per second and per sensor behave very differently as you grow
Retention depth: Ask how long data stays queryable at full granularity, not how long it is stored in aggregate
Deployment options: Self-hosted, multi-site and air-gapped options decide viability under data residency rules
What happens after detection: Whether the tool raises a ticket and assigns an owner, or stops at a dashboard
Correlation with other signals: Whether traffic can be examined alongside metrics, logs and configuration changes without exporting between systems
What Are Network Traffic Analysis Best Practices?
Six practices separate a traffic platform that earns its license from one that generates noise.
1. Baseline Before You Alert
Thresholds set on day one produce a month of noise.
Collect two to four weeks of traffic before configuring any threshold
Establish normal per link and per application, not per network
Use dynamic baselining where weekly patterns are strong
2. Match Sampling Rate to Link Speed
Unsampled export on a high-speed link generates more records than most collectors handle well.
Sample aggressively on high-speed core links
Sample lightly on edge and WAN links where individual conversations matter
Record the sampling rate where the next engineer will find it
3. Tier Your Retention Deliberately
Retention should be set by the questions you get asked, not the storage you happen to have.
Full-granularity flow for 30 days as a working default
Aggregated flow for 12 months to support capacity and budget decisions
Packet capture for 48 hours on selected segments only
4. Tag Traffic by Business Service
Raw flow names an IP address, which means nothing outside the network team.
Tag by application, business service, site and owner
Attribute consumption to a cost center for chargeback
Carry tags into alerts so ownership is clear on arrival
5. Plan for Encrypted Traffic Before You Need To
The share of traffic that cannot be read from the payload keeps rising.
Decide whether your investigation workflow depends on payload visibility
Shift network traffic behavior analysis toward metadata and certificate information
Agree where decryption happens and who approves it
6. Connect Traffic Alerts to Your Incident Process
An anomaly nobody owns gets rediscovered every few weeks.
Route traffic alerts into the same queue as other incidents
Attach an owner and a priority on creation
Record the resolution so the pattern is recognized next time
Applied together, these turn advanced network traffic analysis from a specialist activity into ordinary operational work, which is where proactive network monitoring starts paying back.
How Do You Choose the Right Network Traffic Analysis Tool?
The best network traffic analyzer for your team is chosen by matching the data model to your primary question, then filtering by deployment constraint and budget.
Capacity and cost questions: Flow, not packets. ManageEngine NetFlow Analyzer or SolarWinds NTA fit, and PRTG covers it at smaller scale
Security investigation: Transaction depth. ExtraHop RevealX is built for it, with Wireshark covering manual work
Cloud and container traffic: Device flow export misses most of it. Kentik and Datadog approach it from flow logs and agents respectively
Tight budget: ntopng plus Wireshark covers a single site, and PRTG's free tier handles a small network
Traffic isolated from other monitoring: The consolidation decision matters more than the tool choice, which is where ObserveOps fits
Most shortlists converge on the same names, and that consensus is broadly right. ManageEngine, SolarWinds, Wireshark, Kentik, PRTG and ExtraHop are each genuinely good at what they do.
Two criteria decide whether any of them work in practice, and neither shows up on a feature matrix.
The first is where the alert ends. Detection quality is easy to assess and rarely the constraint. What decides engineering hours is whether an anomaly reaches a named owner with a ticket and an audit trail, or renders a chart that waits to be noticed.
The second is where the data can live. Traffic analysis in network security reveals more about an organization than almost any other telemetry, and in banking, government, healthcare and telecom it frequently cannot leave the premises. Several strong products here are SaaS only, which removes them from consideration whatever else they score.
A third criterion is specific to this category. When flow shares a data store with metrics and logs, a bandwidth spike traces to the device metric and the log line in one query. When it does not, the same investigation becomes an export, a timestamp reconciliation and a spreadsheet.
Motadata's origin is in network monitoring for large, regulated, multi-site organizations, which is why ObserveOps was designed around on-premises and distributed deployment with flow, metrics, logs and traces in one store.
Choose Network Traffic Analysis Tools That Fit Your Network and Budget
The right choice starts with an accurate description of your own situation. A single site with one vendor's hardware and a skilled engineer may genuinely not need to spend anything, and router flow exports plus Wireshark will carry that team further than most vendors would like to admit.
That description stops being accurate sooner than expected. A second site appears, a cloud migration moves half the interesting traffic beyond your collectors, and an auditor asks about last quarter. Motadata ObserveOps was built for what follows: flow analysis across NetFlow, sFlow, jFlow and IPFIX, correlated with metrics, logs, traces and topology in one platform, deployable on-premises or across multiple sites, with anomalies becoming assigned tickets instead of charts. For the wider category, our guide to network monitoring software covers availability and performance alongside traffic.
FAQs
What is the best tool for monitoring network traffic?
No single tool wins, because the answer depends on whether you need flow summaries or packet detail. Flow platforms suit capacity planning and bandwidth investigation across a whole network. Packet analyzers suit protocol-level troubleshooting on one link, and Motadata ObserveOps covers flow alongside metrics and logs.
What is the difference between network traffic analysis and network monitoring?
Network monitoring tracks whether devices and links are available and performing within thresholds. Network traffic analysis explains what moves across those links, broken down by application, conversation, protocol and endpoint. Most organizations need both, which is why several platforms now combine them instead of selling them separately.
Is Wireshark enough for network traffic analysis?
Wireshark is excellent for packet-level investigation and free, but it captures one interface at a time and does not monitor continuously. It has no alerting, no retention policy and no network-wide view. It works best alongside a platform collecting flow data across the whole network.
How should I compare network traffic analysis tools before buying?
Check flow protocol coverage against what your hardware exports, then model the licensing unit at three times your current size. Ask how long data stays queryable at full granularity, and verify deployment options against your data residency rules. Finally, confirm what the tool does after it detects something.
Should I choose Motadata ObserveOps or a dedicated flow analyzer?
It depends on your environment. Where traffic analysis is the only gap and the rest of your monitoring works well, a dedicated flow analyzer costs less and does that job thoroughly. Where flow lives in a separate console from metrics and logs, ObserveOps removes the correlation work that separation creates.
Author
Poonam Lalani
Content Strategist
Poonam Lalani is a B2B content strategist and writer with a background in computer engineering and experience across enterprise technology domains, including AI, cloud, DevOps, data engineering, and IT operations. She specializes in creating research-driven content that simplifies complex ideas and supports product education, thought leadership, and business growth.