Telecom Network Monitoring Software: What Carrier and Operator Networks Require
A telecom network is not a bigger enterprise network. It runs tens of thousands of elements across a wide area, and most of those sites have nobody standing next to them.
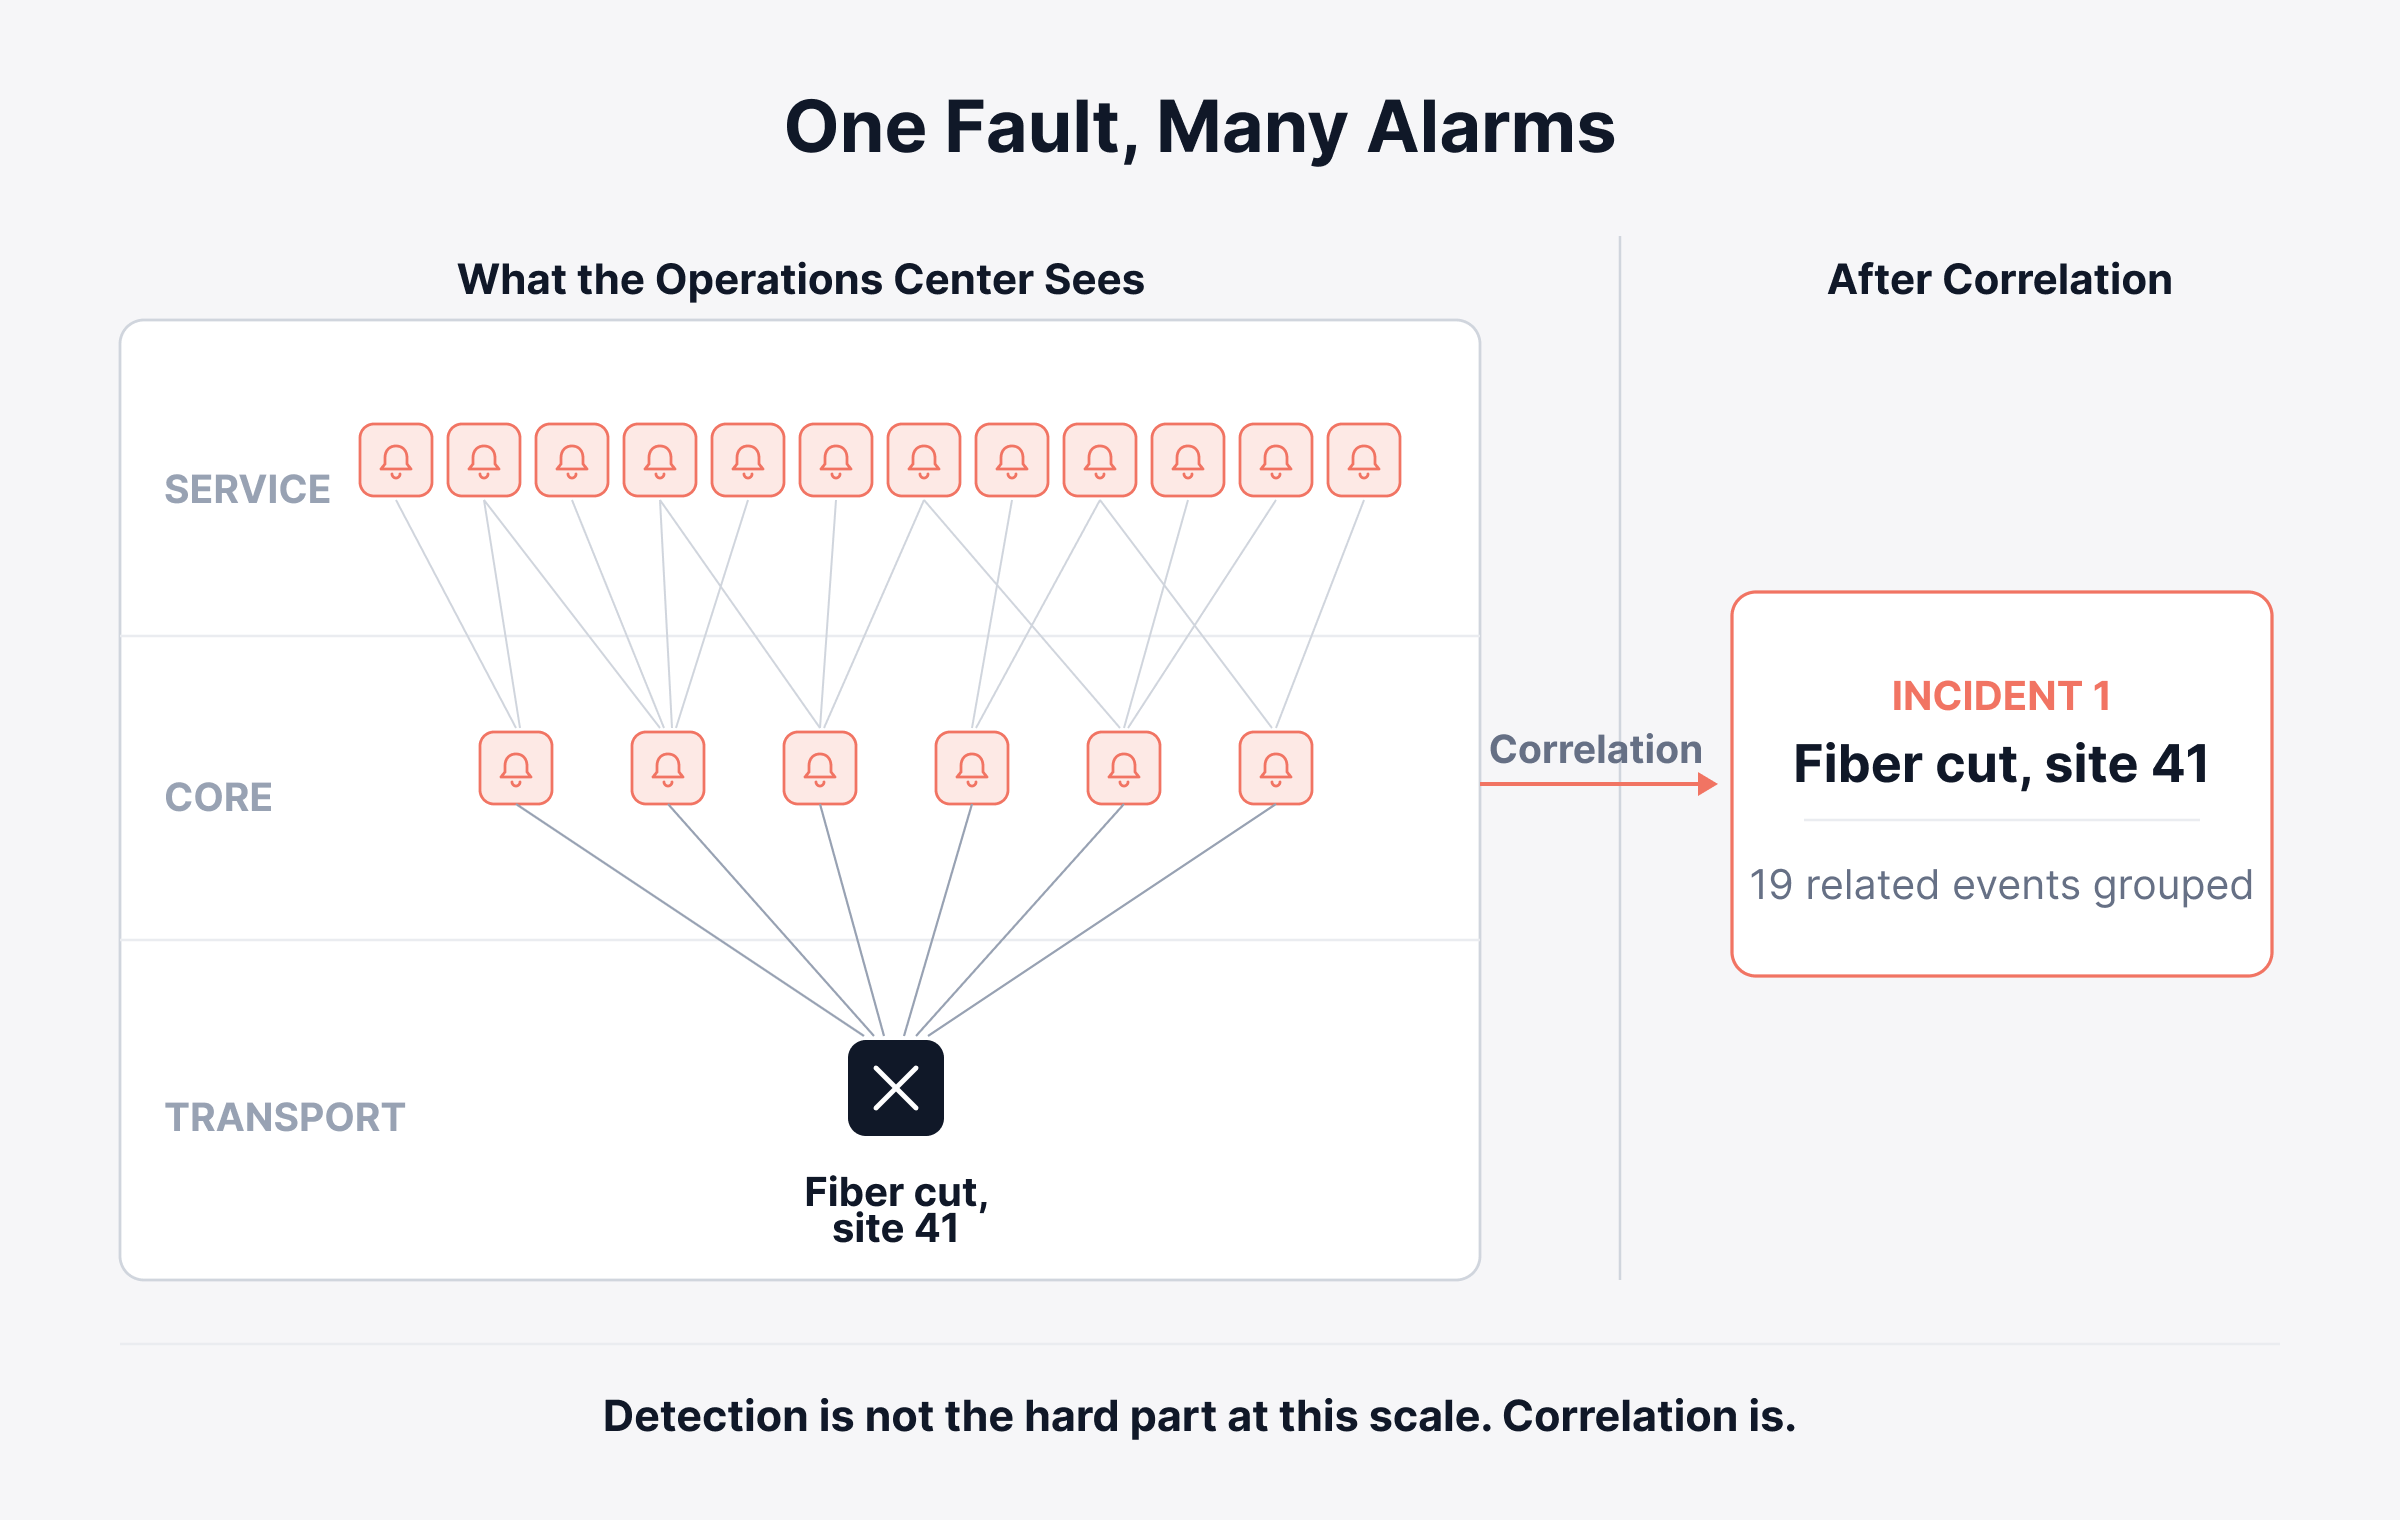
That scale changes the job. Detection stops being the hard part. Correlation becomes the hard part, because one physical failure can raise alarms on dozens of elements at once.
Telecom network monitoring means watching those elements, links and services all the time. It then turns what they report into something an operations team can act on. It covers the physical plant, the transport layer, the core elements and the service each subscriber receives.
Enterprise tools were built for a different shape of problem. They assume a few hundred devices in a handful of buildings, all reachable by one team.
This article covers what the monitoring scope includes and how it differs from enterprise monitoring. It also covers the challenges operators run into, and what to look for in a platform.
What Is Telecom Network Monitoring?
Telecom network monitoring collects fault, performance and configuration data from every element in a carrier network. It answers two questions at once. Is the equipment healthy, and is the subscriber getting the service they pay for?
What the Monitoring Scope Covers
The scope runs across four layers of the operator estate.
Physical infrastructure comes first. This is the plant itself: towers, power, cabling and the conditions at each site.
The transport layer carries traffic between sites. Microwave links, fiber spans and the equipment terminating them all report their own health.
Core network elements sit above that. These are the switches, routers and gateways that make the service work at all.
Service quality sits on top. This is what the customer gets, measured as latency, loss and whether the service is up at all.
How the Telecommunication Management Network Framework Fits
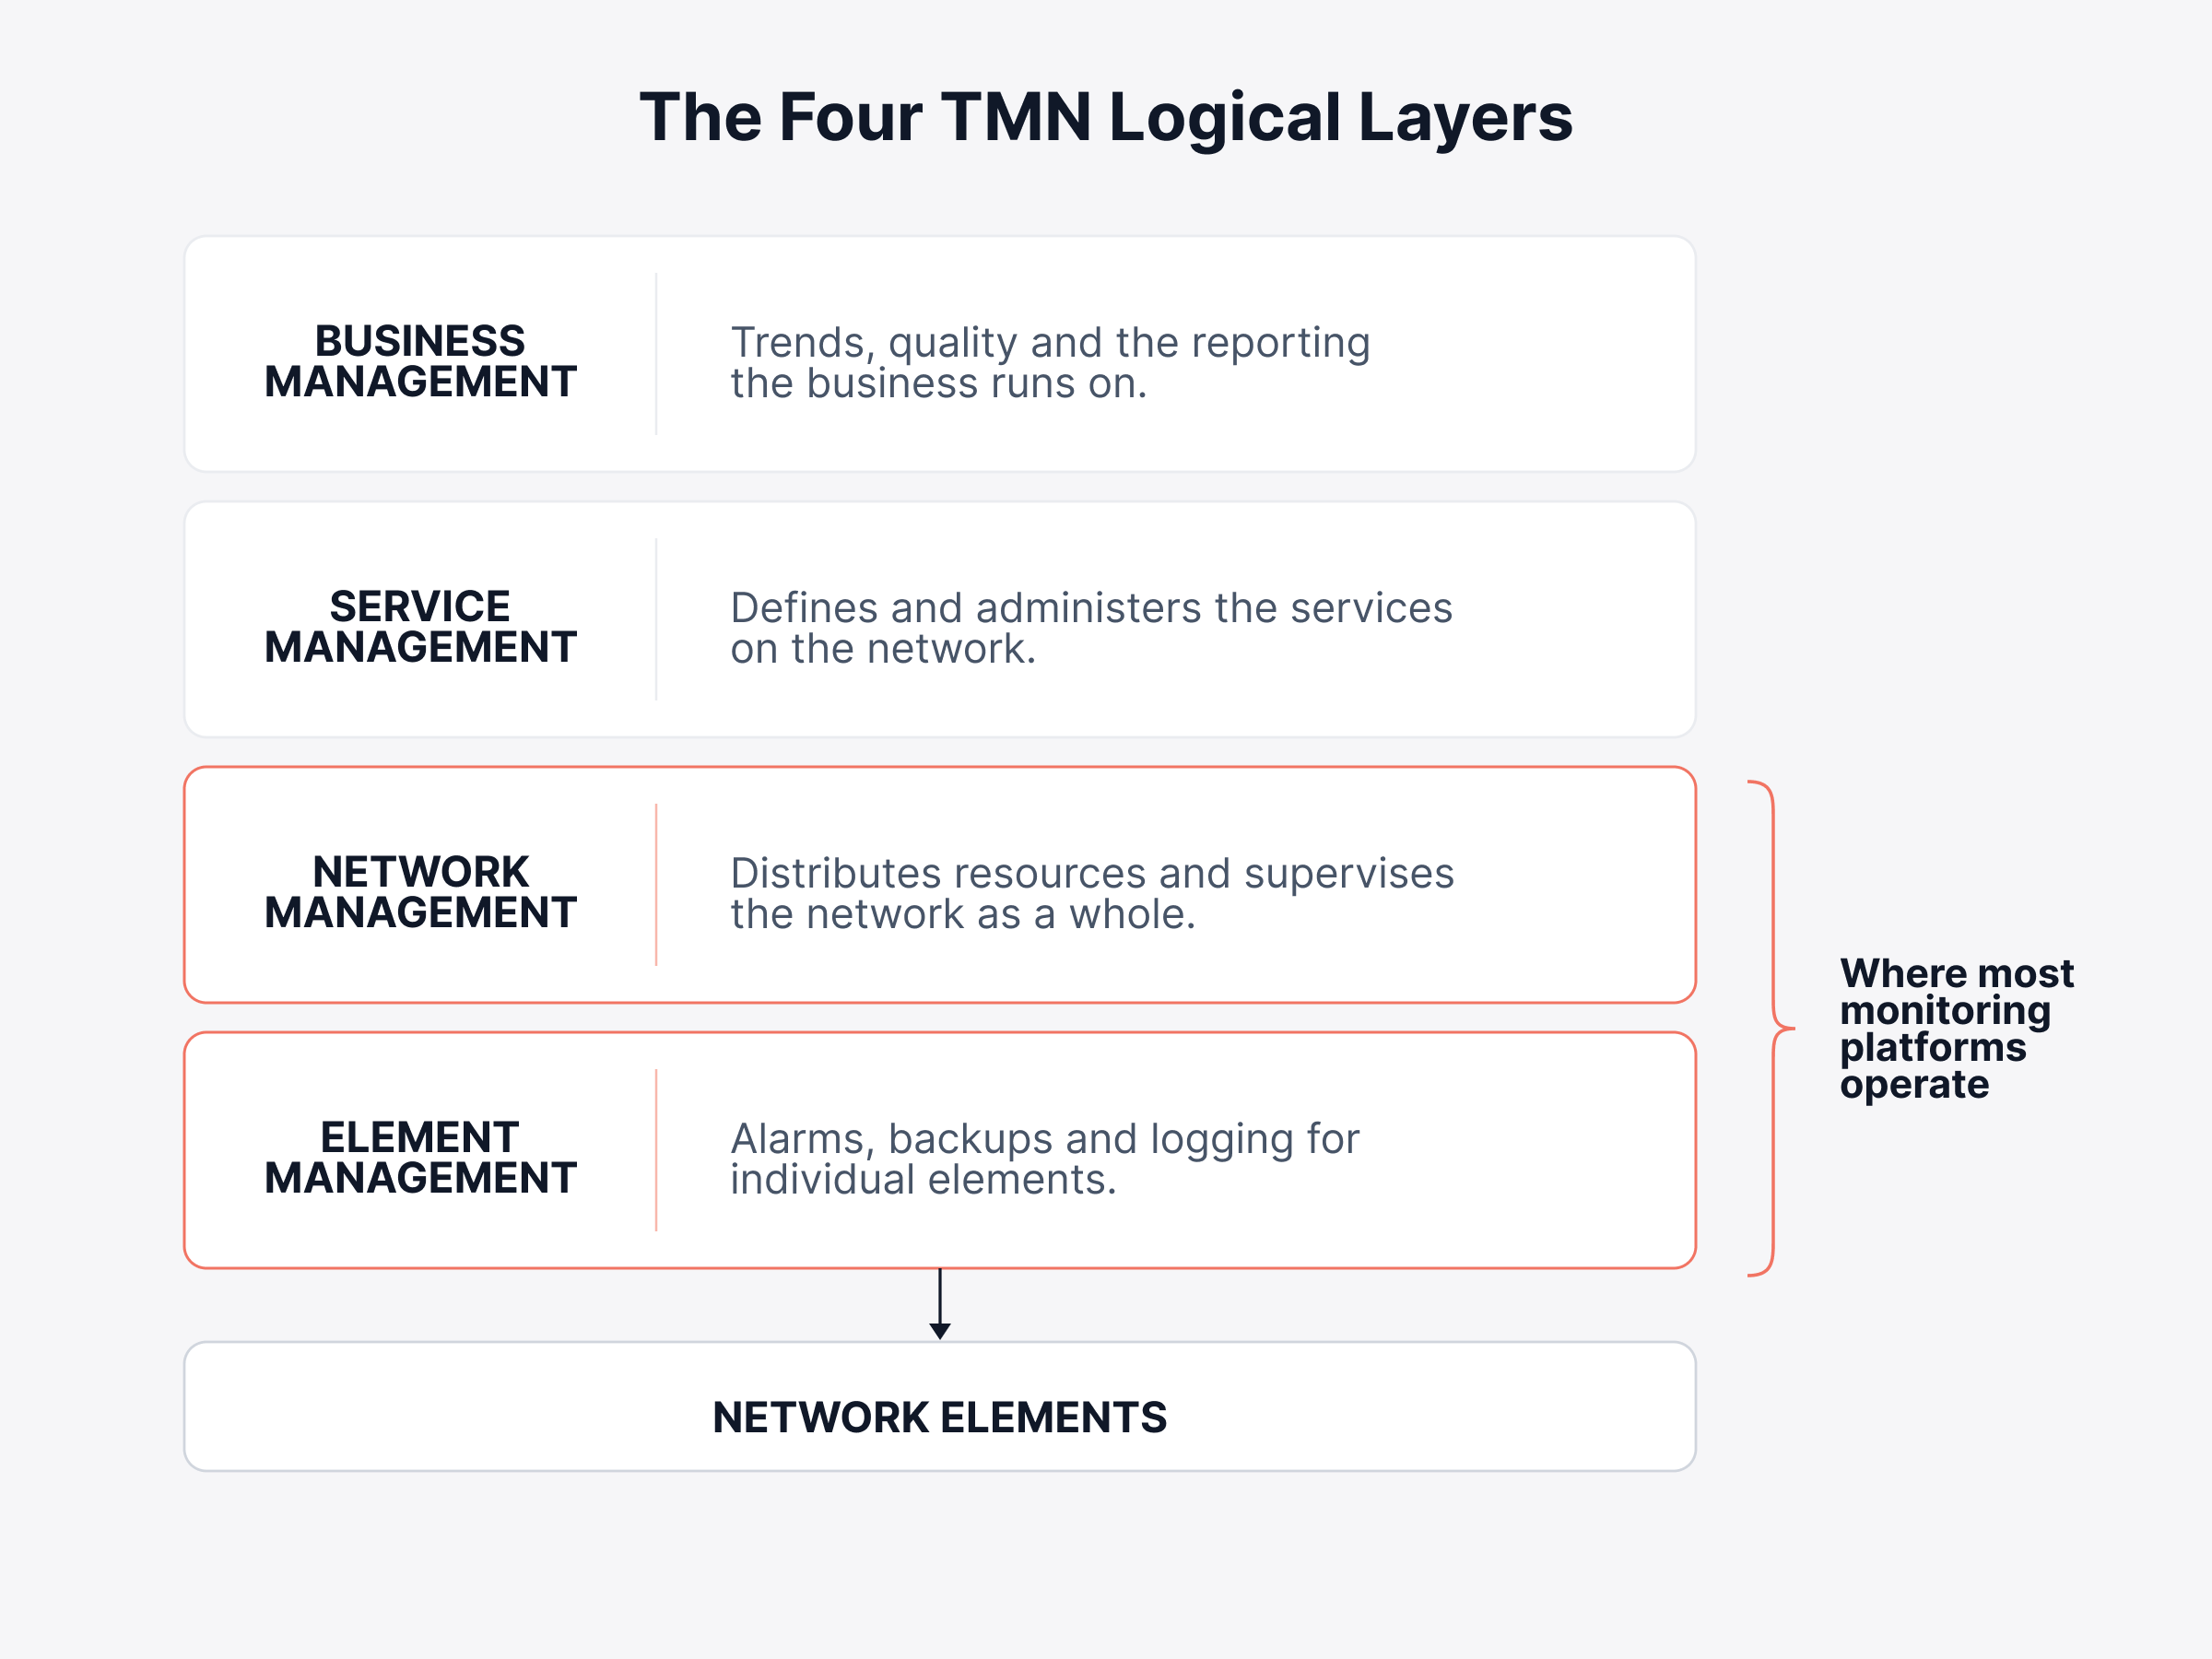
The telecommunication management network, usually shortened to TMN, is the ITU-T framework that organizes this work. It is set out in the ITU-T M.3000 series, with the founding rules in M.3010.
TMN sorts the work into four logical layers. Element management handles single network elements, including alarms, backups and logging. Network management distributes resources and supervises the network as a whole.
Service management sits above those two. It defines and runs the services on the network. Business management sits at the top, covering trends, quality and the reports the business needs.
Telecom network management is the wider job, and monitoring is the part of it that watches and reports. A telecom network management system usually covers both, and adds configuration and provisioning on top.
Most monitoring platforms work at the element and network layers. Knowing which layer a tool sits at tells you which questions it can answer.
How Does Telecom Network Monitoring Differ From Enterprise Monitoring?
Telecom network monitoring differs from enterprise monitoring in four ways. Each one breaks a tool built for a corporate network. The four are scale, spread, vendor mix and who the service is promised to.
The Element Count Changes the Alert Problem
A corporate network holds a few hundred devices. An operator network holds far more, and every one of them can raise an alarm.
So event volume crosses the line where a team can read it. The platform has to reduce that volume before a human sees it, or the operations center drowns in a normal week.
The Network Spans Sites With Nobody On Them
The network infrastructure an operator runs stretches across a wide area, and most of those sites have no technician on them.
Enterprise tools assume someone can walk to the device. Operators cannot. Your team has to work the fault out from a desk, and finish the job there. A site visit costs money and hours.
Every Vendor Brings Its Own Management Interface
Operator estates are multi-vendor by necessity. Equipment arrives from different suppliers across different procurement cycles, and each supplier ships its own element manager.
Those managers do not agree on data models, alarm names or severity levels. A platform that speaks only one vendor's language leaves you with a wall of screens and no view across the path.
The Service Obligation Runs to Subscribers, Not Staff
An enterprise tool answers to internal users. An operator answers to subscribers under contract, and often to a regulator as well.
That changes what a fault costs. Internal downtime costs staff time. Subscriber downtime costs revenue, and it can trigger credits, penalties or a report to a regulator.
So the question a platform has to answer is not only which element failed. It is how many subscribers that element was carrying.
What Challenges Do Telecom Operators Face in Network Monitoring?
Five problems come up in almost every operator estate. Name them before you look at any platform, because each one is a requirement in disguise.
1. Alert Volume Outruns the Operations Team
A large estate produces more events than any team can read. The common response is to raise thresholds, which quietly hides the events you needed.
The workable response is correlation. The platform groups related events into one incident, so the team reads a handful of incidents instead of a flood of alarms.
2. Each Vendor's Tooling Covers Only Its Own Equipment
Every supplier ships a capable element manager for its own gear. None of them cover the gear sitting next to it.
So operators end up with several tools, several alarm formats and no view across the whole path. Correlating a fault across those tools becomes a manual job, usually done by whoever has been there longest.
3. One Physical Failure Surfaces as Dozens of Symptoms
Faults spread upward. A single fiber cut or power failure at one site raises alarms on every element that depended on it. Those alarms land in every layer above.
The operations team then sees dozens of symptoms and no cause. Fault isolation means working back down the dependency chain to the one element that actually failed, while the alarms keep arriving.
4. Diagnosis Has to Finish Before Anyone Is Dispatched
Remote and unstaffed sites make the cost of being wrong high. Sending an engineer to the wrong site burns a day and fixes nothing.
So the platform has to carry enough detail to reach a conclusion from the operations center. That means site readings, power state, interface counters and change history, not just an up or down flag.
5. Capacity Planning Runs Against Subscriber Growth
Subscriber numbers move, and traffic patterns move with them. Capacity decisions made on a guess either waste money or run out early.
The way out is measurement over time. Trend data on usage per link and per site turns a capacity argument into a budget line somebody will approve.
What Capabilities Should a Telecom Network Monitoring System Have?
The capabilities below separate a platform built for an operator estate from a general network tool. Network monitoring for telecom operators has to start from multi-vendor reality and a large element count, not from a single-site corporate LAN.
Treat each one as something to test during a trial, on your own equipment mix. A demo on the vendor's lab gear proves very little about your estate.
Ask for a trial on a slice of your live network instead, with your own alarm volumes running through it. What holds up on ten devices often falls over on ten thousand.
Performance Monitoring Across Distributed Network Elements
Network performance monitoring tracks availability, latency and usage for every element and link you run.
Every vendor claims this one, so test the four things that actually separate them.
Baselines, not fixed thresholds: A static threshold that suits a busy core link will be wrong for a rural access site. The platform should learn what normal looks like at each element.
Down time, not just recovery: You need to know how long an element was down, not only that it came back. That figure is what a service credit is worked out from.
Latency, not just reachability: Latency is the number that tells you a service is degraded while every element still reports itself healthy.
Polling interval at your scale: Ask what interval the platform holds at your element count. A five-minute poll hides a two-minute outage.
Traffic and Flow Analysis
Availability tells you a link is up. It does not tell you what is moving across it.
Flow analytics reads the flow records your routers already export. It turns them into a picture of traffic by source, destination, application and interface.
That picture does three jobs for an operations team.
It answers the congestion question: When a link saturates, you can see what filled it instead of guessing.
It separates growth from noise: A genuine upward trend looks nothing like one misbehaving source, once you can see the traffic behind the number.
It makes capacity planning defensible: Measured usage over months is evidence. An estimate is only an argument.
Multi-Vendor Device Monitoring Through Standard Protocols
Standard protocol support decides whether one platform can cover a mixed estate at all.
SNMP monitoring is the common ground. Almost every piece of network equipment speaks it. So a platform with broad SNMP support and a large template library can pick up gear from suppliers it has never seen.
Three protocols carry most of an operator estate, and each one answers a different question.
Protocol | What it gives you | What to check |
SNMP | Polled state, interface counters and traps from almost any device | Version 3 support, and the size of the device template library |
Syslog | Event and error messages as the device emits them | Whether your team can edit the parsing rules without vendor help |
Streaming telemetry | Metrics pushed continuously, at a higher rate than polling allows | Which of your device models actually support it today |
Then ask how the platform handles a device with no existing template. Ask whether your team can extend one, or whether every new model becomes a support ticket and a wait.
How Do Configuration Changes Affect Network Stability?
Configuration change is a common source of instability. It is also the one operators control most directly. The change looks routine, it goes in during a maintenance window, and the fault appears somewhere nobody was watching.
Configuration Drift Builds Quietly
Drift is the gap between the configuration you think is running and the one that is. It grows through small manual edits made under pressure and never recorded.
You find drift at the worst moment. A device fails, the replacement is built from a stored version, and that version no longer matches what the site needs.
Drift also breaks your baseline. If the stored version is wrong, every check you run against it is wrong too.
Backups Only Help Against a Known Good Baseline
A configuration backup is useful only if you know which version was working. So the platform has to store versions, show the difference between them, and push a known good version back to the device.
Rollback speed is what turns a long outage into a short one. The team needs to restore a working configuration without rebuilding it by hand at three in the morning.
Policy Checking Catches the Change Before It Ships
Network compliance management checks device configurations against the policy you set, then flags the device that breaks it.
That covers the obvious security items, such as default credentials and open management interfaces. It also covers operational standards, such as required SNMP settings and logging destinations, which are the ones that quietly break monitoring itself.
What Should Telecom Operators Look For in a Monitoring Platform?
Five questions separate platforms once you get past the feature list.
1. What Is the Tested Scale Ceiling?
Ask for the element count the platform has been tested to, and ask what happens when you reach it. A number from a lab is worth less than a reference estate of similar size and shape to yours.
2. How Broad Is the Protocol and Vendor Support?
Check SNMP coverage, syslog handling and the size of the device template library. Then hand the vendor a list of your least common equipment and ask what onboarding it involves.
3. Which Deployment Models Are Available?
Regulation and data residency rules settle this for many operators. Confirm that on-premise deployment is a supported model, not an exception the vendor makes once.
4. How Good Is the Correlation?
This is the capability that decides whether the operations center copes. Ask to see a fault injected on a shared dependency, then count how many incidents the platform raises for it.
5. How Does It Fit the OSS You Already Run?
Your existing operations support systems are not going away. Check whether the platform passes events and inventory into them through a supported interface rather than a custom project.
Where This Leaves Your Shortlist
Answer those five and the shortlist usually resolves itself. Our network monitoring tool covers multi-vendor discovery, performance monitoring, flow analysis and configuration management on one platform.
Book a demo and bring your hardest site to it, not your simplest one.
Build Your Monitoring Around Correlation, Not Alarm Count
Scale is what makes operator monitoring hard, and correlation is what makes scale survivable. A platform earns its place by turning a flood of alarms into a short list of causes.
So test that part first. Inject a fault on a shared dependency and count the incidents it raises. Hand over your least common equipment and see how long onboarding takes.
Then check the parts that bite later. Confirm that on-premise deployment is supported, that stored versions roll back cleanly, and that events reach the OSS you already run.
The estate will keep changing around you. New suppliers arrive, sites get added, and traffic moves. The platform has to keep up with all of it.
You can start a free trial and run those tests against your own equipment mix.
FAQs
What are the five types of network management?
The five are fault, configuration, accounting, performance and security management, known together as FCAPS. The model comes from the ISO and ITU-T network management framework. Most telecom monitoring platforms cover the fault, configuration and performance areas directly, and feed the other two.
What is network fault management?
Fault management is the work of detecting, isolating and correcting malfunctions in a network. In telecom it also covers alarm enrichment and suppression, because a single failure raises alarms on every element that depended on it. The goal is one incident with a cause, not a list of symptoms.
What is NMS in telecommunications?
An NMS, or network management system, manages the network as a whole and correlates data across many elements. An EMS, or element management system, manages devices from one vendor in detail. Operators usually run several element managers underneath one network management layer. A monitoring platform normally sits at that upper layer.
What are the types of network monitoring?
Monitoring is usually split by what it collects. Availability and fault monitoring polls devices for state. Performance monitoring tracks metrics such as latency and usage. Flow monitoring reads traffic records, and configuration monitoring tracks changes to device settings.
Author
Ramya Shah
Technical Writer
Ramya Shah is a technical content writer with a computer engineering background and roots in automotive journalism. He covers IT Service Management, observability, IT operations, and AI-driven automation. An early adopter of AI-assisted writing workflows, he turns complex IT processes into clear, engaging content optimized for search and answer engines (AEO), lifting content output and organic visibility.