What to Monitor in Active Directory to Keep Logons Fast and Access Under Control
Why do logons crawl at one branch while headquarters is fine, or an admin group gain a member nobody approved, and no alert says a word? Trace any of those back far enough and you usually reach Active Directory. Since email, VPN, file shares and line-of-business software all lean on it for credentials, a directory fault rarely looks like itself and tends to show up as a network outage or a bug in some other application.
Most of these faults creep in. Replication can stop for days while the domain controller's CPU and memory graphs look perfectly ordinary. A risky group change can wait in the security log for weeks until an audit finds it, and by then the fix costs more.
This guide explains how to watch Active Directory as a living identity service, from the health of each domain controller to the changes made inside it. In this blog, you will see:
What to monitor in Active Directory: Seven areas, from domain controller health to privileged group changes
Which event IDs matter: Security, directory service and replication events worth an alert
How to check AD health: Built-in commands for replication, FSMO roles and time sync
How to set up AD monitoring: A six-step rollout with baselines and alert routing
How to prove value: Measures that show leadership what monitoring saves in downtime, risk and effort
How to choose tools: What each category of Active Directory monitoring tools covers and where it stops
What is Active Directory Monitoring?
Active Directory monitoring is how you learn about directory trouble before your users, or your auditors, find it for you, by watching domain controller health, replication, sign-ins and changes around the clock. The data comes from every domain controller as performance counters, service checks and security events. You read all of it in one place.
AD monitoring usually breaks down into four layers:
Health and performance: Resources, services and database behavior on each domain controller
Replication: Whether every domain controller holds the same, current copy of the directory
Authentication: How quickly domain controllers answer directory lookups through LDAP and sign-in requests through Kerberos and NTLM
Security and change: Who logged on, what changed and whether the change was expected
Active Directory performance monitoring and Active Directory security monitoring are often run by different groups with different tools. That split costs time. Fifty failed logons in ten minutes might mean an attacker, or just one forgotten application still sending last month's password; the metrics and changes around those failures are what settle it.
How is AD Monitoring Different from Windows Server Monitoring?
AD monitoring starts where server monitoring leaves off. A domain controller can tick every box on a server checklist and still be failing at the one job it exists for. Windows server monitoring covers CPU, memory, disk and services, while directory monitoring adds replication, role ownership, sign-in speed and the directory's own event trail.
Put both views on one screen if you can. When LDAP answers slow down in the same minute the database disk does, you are almost certainly looking at one incident and full-stack observability shows that on a single timeline. That shared view matters most once you count what a directory fault costs the business.
Why Does Active Directory Monitoring Matter to the Business?
Active Directory monitoring matters because almost nothing in a Windows environment works until the directory has answered first. Slow the directory down and every application that authenticates against it slows down with it. The business feels it in four ways.
Lost working time: Slow logons, failed drive mappings and delayed Group Policy affect every employee at once, usually at the start of the working day
Security exposure: Attackers who obtain one valid credential work through Active Directory to gain more privilege, so unnoticed group and policy changes widen the damage
Audit findings: Regulatory compliance frameworks such as SOX, HIPAA and PCI DSS expect evidence of who changed access and when, and missing records become findings
Outage spread: Email, file shares, VPN, Wi-Fi authentication and line-of-business applications fail together when domain controllers stop answering
A two-site manufacturer makes a good example. After a routine firewall change, the plant's domain controller stops hearing from headquarters, password resets made at head office never reach it, and the help desk loses a morning unlocking accounts before anyone looks at replication. None of this is unusual, and most of it comes down to how quietly Active Directory fails.
What Makes Active Directory Hard to Monitor at Scale?
Active Directory turns hard to monitor at scale for two plain reasons. Its signals are split across many servers, logs and protocols, and Windows writes fewer of them by default than most admins assume. Four obstacles come up repeatedly:
Scattered signals: Each domain controller keeps its own logs and counters, so a problem at one branch can stay invisible from headquarters
Incomplete default auditing: Several of the most useful security events are not recorded until advanced audit policies and object auditing are switched on
High event volume: Busy domain controllers write large numbers of security events, and without filtering the important ones are lost in alert noise
Split ownership: Infrastructure, security and help desk groups each see one part of the directory, so incidents pass between them before anyone sees the full picture
Each obstacle adds time between the first symptom and the fix. The seven monitoring areas below are designed to shorten that time.
What Should You Be Monitoring in Active Directory?
What you should be monitoring in Active Directory comes down to seven areas. The first four keep the directory running. The last three tell you whether you can trust what is in it.
1. Domain Controller Health and Resources
Domain controller monitoring starts with the hardware the directory runs on. NTDS.dit, the directory database, is read and written constantly, along with its transaction logs. So a slow disk or tight memory shows up as slow sign-ins long before the server looks busy.
Track these metrics on every domain controller as the base layer of AD health monitoring:
CPU and memory: Sustained high use, and memory too low to cache the directory database
Disk latency and free space: Separate readings for the volumes that hold NTDS.dit, its logs and SYSVOL, the shared folder for Group Policy files
Database cache hit ratio: A falling ratio means more directory reads are going to disk
Log write latency and stalls: Slow transaction log writes delay every directory update
Network throughput and errors: Interface errors and saturation on links used for replication and logons
Collecting these through server performance monitoring gives each domain controller its own baseline. A gradual slide then stands out against that controller's normal pattern, and fixing it early costs far less than recovering from failed logons across the business.
2. Core Active Directory Services
Core service monitoring is about the Windows services Active Directory cannot run without. Stop Netlogon or the Kerberos Key Distribution Center (KDC) on a domain controller and the server still answers ping, still accepts remote desktop and still passes a basic availability check. Process monitoring watches each service and flags the stop straight away.
Each service in this table does one job. When it stops, users notice something specific.
Service | What it does | What users notice when it fails |
Active Directory Domain Services | Hosts the directory database and answers LDAP queries | Logons, lookups and group checks fail |
Kerberos Key Distribution Center | Issues Kerberos tickets for authentication | Logons fall back to NTLM or fail |
Netlogon | Registers DNS records and handles secure channel logons | Clients cannot locate a domain controller |
DNS Server | Resolves names and the service records clients use to find domain controllers | Slow logons, failed domain joins, broken replication |
DFS Replication | Replicates SYSVOL, including Group Policy files and logon scripts | Group Policy applies inconsistently across sites |
Windows Time | Keeps clocks in sync across the domain | Kerberos rejects tickets once clocks drift too far |
DNS deserves particular attention, because clients find domain controllers through DNS service records and many logon delays trace back to name resolution. Our guide on slow DNS lookups covers the Active Directory side of that problem in detail.
3. Active Directory Replication Health
Active Directory replication monitoring confirms that each domain controller receives its partners' changes on time. Inside a site that takes seconds. Across sites the out-of-the-box schedule is every 180 minutes, which makes three hours of lag fine on one link and alarming on a link set to replicate hourly.
Track replication from these angles:
Last successful replication: Per partner and per directory partition, compared with the expected schedule
Pending synchronizations: A growing queue means a domain controller is falling behind
Replication errors: Error codes for access denied, DNS lookup failures and unavailable RPC servers
Tombstone lifetime risk: Any domain controller approaching 180 days without replication, the default tombstone lifetime, which is how long deleted objects are kept
SYSVOL replication state: DFS Replication backlog and errors, since Group Policy files travel separately from directory data
There is a hard limit as well. A controller cut off past the tombstone lifetime can bring deleted objects back when it returns, and cleaning up those lingering objects can take days, so alert well before that point. Once replication does stop, root cause analysis tends to end at a few usual suspects, with DNS and firewall rules near the top and a failed partner controller close behind.
4. FSMO Roles and Global Catalog Availability
FSMO role monitoring answers one question for each of the five Flexible Single Master Operations roles: is the controller holding it up, reachable and healthy? Most directory work can run on any controller. These five jobs run only on the role holder:
Schema Master: Approves schema changes, usually during upgrades that extend the directory
Domain Naming Master: Adds and removes domains in the forest
RID Master: Hands out pools of relative IDs so domain controllers can create new users, groups and computers
PDC Emulator: Acts as the domain's time source, processes account lockouts and receives password changes first
Infrastructure Master: Updates reference to objects held in other domains
Users feel PDC Emulator trouble first, because time sync and lockouts depend on it. Forests with several domains add another dependency, the global catalog, which a logon needs before it can check universal group membership. A RID Master that stays down long enough causes a quieter problem, as the pool of IDs runs dry and new hires wait for accounts that cannot be created.
5. Authentication Performance Across LDAP, Kerberos and NTLM
Authentication monitoring is the part users experience directly, since it measures how quickly and reliably each domain controller handles LDAP, Kerberos and NTLM requests. A replication queue means nothing to an employee, whereas a ten-second logon gets reported fast. Every logon and every file share waits on those answers.
LDAP bind time and search rate: Rising bind time points to an overloaded domain controller or an expensive query from an application
Kerberos and NTLM authentications per second: A growing share of NTLM often means Kerberos is failing, for example through missing service principal names, the identifiers Kerberos uses for services, or clients connecting by IP address
Request queue delay: Requests waiting for a worker thread signal a capacity limit on the domain controller
Time offset: Kerberos rejects tickets when clocks differ by more than five minutes, which is the default tolerance
A domain logon runs through four steps in order. The flow below names the metric that shows which step is slowing users down.
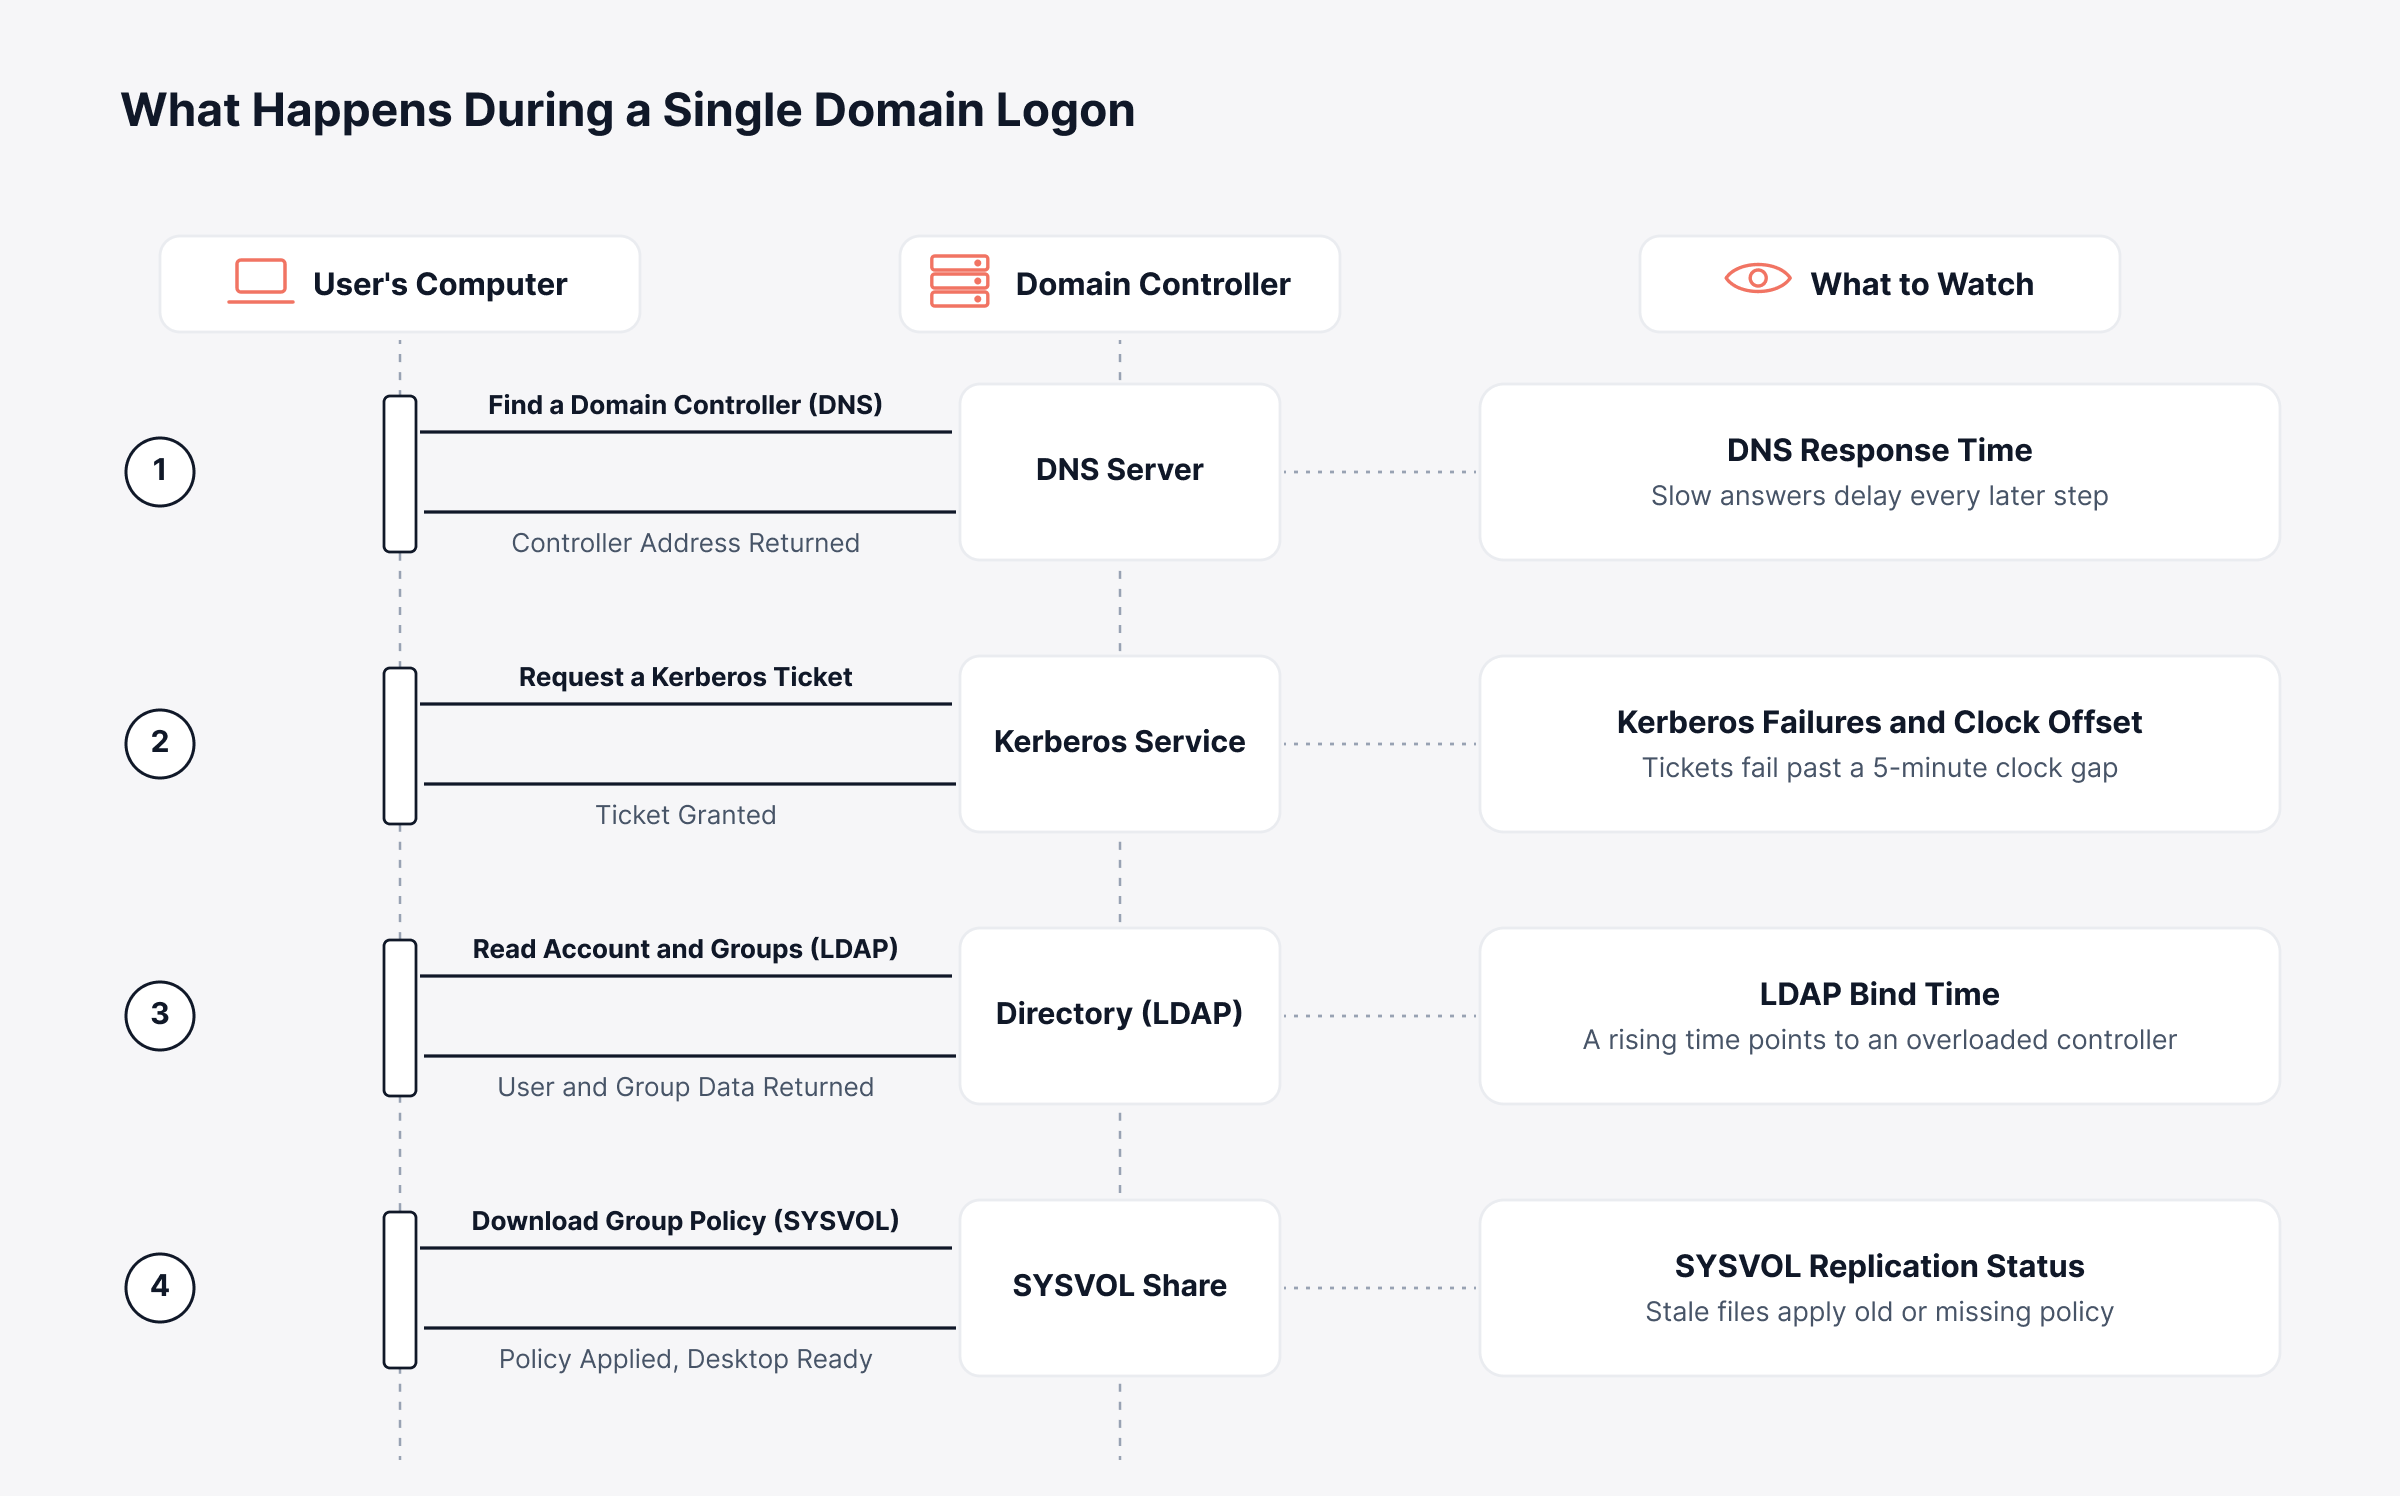
Break these metrics out by domain controller and by site. A single sluggish controller that one office happens to prefer can make that office feel broken while everyone else works normally.
6. User Account and Logon Activity
Account activity monitoring looks for the difference between everyday use and misuse in logons, failed attempts and lockouts. Here the source for Active Directory log monitoring is the Security channel of the Windows event log on every domain controller. Every authentication attempt lands there.
To monitor Active Directory activity at the account level, focus on these patterns:
Failed logons by account and source: A spike from one source suggests password spraying or a misconfigured service
Account lockouts: Repeated lockouts of one account usually trace to a stale saved password on a phone or mapped drive
Privileged account logons: Admin logons to ordinary workstations or from unusual machines widen the attack surface
Service account behavior: Interactive logons by service accounts, or logons from new hosts, deserve review
Dormant account use: A logon from an account unused for months is worth an immediate look
Consider a retail chain where a payment application's service account starts locking out after a scheduled password change. Monitoring traces every lockout to one server still holding the old password. The fix goes there, before checkout terminals across the region start declining cards.
Whether a lockout is unusual depends on the details around it. Hand the help desk the name of the device causing it and they will clear it in minutes. With only a count, those minutes go on phone calls.
7. Directory, Group Policy and Privileged Group Changes
Change monitoring records who modified directory objects, policies and permissions, and flags changes that fall outside approved work. The first questions after any incident, and in any audit, are about what changed, who made the change and at what point. This layer holds the answers.
Prioritize alerts on these changes:
Privileged group membership: Domain Admins, Enterprise Admins, Schema Admins, Administrators, Account Operators and Backup Operators
Group Policy Objects: Creation, deletion, linking and edits, especially policies applied to domain controllers
Domain and audit policy: Password, lockout and Kerberos policy edits, and any change to the audit policy itself
Trusts and delegation: New trusts, and accounts granted delegation rights
AdminSDHolder permissions: Edits to the template that protects privileged accounts, which Windows reapplies every 60 minutes by default
Every item on that list connects to privileged access management, since an unapproved name in an admin group means privilege was granted outside the process. Group Policy is the one awkward spot: the native logs will tell you a policy changed, yet pinning down which setting usually means comparing against a backup. A good share of these changes, along with plenty of health problems, show up as specific Windows events.
Which Active Directory Event IDs Should You Monitor?
Of all the event IDs Windows can write, the Active Directory event IDs worth monitoring are the ones that capture sign-ins, account changes, privilege use and directory edits on domain controllers. Security events need the right audit policy before they appear, while health problems go to the Directory Service and DFS Replication logs. For decision-makers it comes down to coverage, since an event nobody collects can hide unauthorized access for a long time.
For a first set of alerts, start with these security events.
Event ID | What it records | Why it matters |
4624 | Successful logon | Shows who logs on where, including admins on workstations |
4625 | Failed logon | Spikes can mean password spraying, one password tried across many accounts |
4740 | Account locked out | Points to stale saved passwords or guessing against one account |
4768 | Kerberos ticket-granting ticket requested | Failure codes reveal bad passwords, expired accounts and clock skew |
4769 | Kerberos service ticket requested | Bursts using older RC4 encryption can signal Kerberoasting, an offline attack on service account passwords |
4771 | Kerberos pre-authentication failed | Often the first sign of password guessing over Kerberos |
4776 | NTLM credential validation | Tracks NTLM use, which should shrink over time |
4672 | Special privileges assigned to a new logon | Marks the start of an administrator-level session |
4720 | User account created | Unexpected accounts can give an attacker persistence |
4726 | User account deleted | Confirms leaver processing or exposes destructive activity |
4728, 4732, 4756 | Member added to a global, local or universal security group | The core alert for privileged group changes |
4738 | User account changed | Covers flags such as password never expires or delegation rights |
4739 | Domain policy changed | Password and lockout rule changes affect every account |
4719 | System audit policy changed | Someone may be reducing what gets recorded |
5136 | Directory service object modified | Records attribute changes, including Group Policy Objects |
4662 | Operation performed on a directory object | Replication rights requested by a non-controller can indicate DCSync, an attempt to copy password hashes |
1102 | Security audit log cleared | Rarely legitimate on a domain controller, so treat it as high priority |
Keep two things in mind with this list. Events 5136 and 4662 stay silent unless directory service auditing is enabled and each object you care about has an auditing entry, which Windows calls a SACL. No single event proves an attack, either, until you read it alongside the account, source machine and time.
Health problems surface in different logs, and these entries deserve alerts of their own.
Event ID | Log | What it signals |
1311 | Directory Service | The replication topology cannot be built, often from site link or connectivity problems |
1864 | Directory Service | A domain controller has not received replication from some partners within the expected window |
2042 | Directory Service | Replication has not occurred for longer than the tombstone lifetime |
2087 | Directory Service | Replication failed because DNS could not resolve the source domain controller |
2887 | Directory Service | Clients made unsigned or clear-text LDAP binds in the past 24 hours |
2213 | DFS Replication | SYSVOL replication stopped after an unexpected shutdown and needs recovery |
4012 | DFS Replication | A domain controller was disconnected from SYSVOL replication too long to resume automatically |
Our guide to Windows event logs explains how these logs are laid out and why reading them server by server stops working. Collect them centrally, and event correlation groups related entries into incidents with context attached. Once an alert has fired, confirming the cause usually takes a few built-in commands.
How do You Check Active Directory Health with Built-In Commands?
Checking Active Directory health on the spot is what dcdiag and repadmin were built for. dcdiag runs a set of tests against domain controllers, and repadmin reports on replication between them. Both are already on every domain controller, and admin workstations get them with the Remote Server Administration Tools.
If something looks wrong, the checks in this table make a sensible first pass.
Command | What it tells you |
dcdiag /e /q | Reports only errors across every domain controller in the forest |
dcdiag /test:dns /v | Tests DNS registration and resolution for each domain controller |
dcdiag /test:dfsrevent | Lists recent SYSVOL replication errors and warnings |
repadmin /replsummary | Summarizes replication failures and largest lag per domain controller |
repadmin /showrepl DC01 | Shows last success and errors for each partner of one controller |
repadmin /queue | Shows how many replication requests are waiting |
netdom query fsmo | Lists which domain controller holds each FSMO role |
nltest /dsgetdc:example.com | Shows which domain controller a client locates and uses |
w32tm /monitor | Compares time offset across domain controllers in the domain |
auditpol /get /category:* | Shows the audit policy actually in effect |
Get-ADReplicationFailure -Scope Domain -Target example.com | Lists replication failures through the PowerShell AD module |
Each command shows one moment. If replication breaks an hour later, nothing tells you until someone runs it again, so use these to diagnose what continuous monitoring has already caught. The setup below builds that continuous layer.
How do You Set Up Active Directory Monitoring Step by Step?
Setting up Active Directory monitoring takes six steps, and the order matters more than it looks. The inventory comes first because every later step depends on knowing what is out there, and alert ownership comes last. Taken together, this is how to do Active Directory monitoring in a way that still holds up after the next reorganization or acquisition.
1. Map Domain Controllers, Sites and Roles
No threshold makes sense until you know what it is measuring, so start by recording:
Each domain controller with its site and operating system
The controllers that hold FSMO roles or act as global catalogs
Trusts with other domains and forests
The replication links between sites
Branch offices often run read-only domain controllers on modest hardware, and those are the machines that slip off inventories first. They also tend to be the first to struggle under load.
2. Turn On Advanced Audit Policy on Domain Controllers
By default, Windows leaves out many events that security monitoring needs. Audit policy decides what gets written to the Security log. Enable these Advanced Audit Policy subcategories:
Logon and account logon: Logon, Special Logon, Credential Validation, Kerberos Authentication Service and Kerberos Service Ticket Operations
Account management: User Account Management, Computer Account Management and Security Group Management
Policy change: Audit Policy Change and Authentication Policy Change
Directory service: Directory Service Changes, with SACLs on the objects you care about
Rolling the policy out takes four moves:
Deploy: Link a Group Policy Object carrying these settings to the Domain Controllers organizational unit
Override legacy settings: Turn on the option that lets subcategory settings take priority over the older audit categories
Verify: Run auditpol on each controller to confirm what is applied
Resize the log: Increase the Security log size so a busy controller keeps its events for more than a few hours
3. Collect Metrics and Event Logs Centrally
Pulling everything into one place means a compromised or rebuilt server no longer takes its evidence with it. For counters and service states, remote polling, known as agentless monitoring, is often enough. Where links are unreliable, a lightweight agent is the safer choice, since it buffers data until the connection comes back.
Event logs can travel by Windows Event Forwarding or through a log collector, and either route works. A platform built for universal log collection keeps directory events beside the server metrics that explain them, and that pairing is where directory observability starts.
4. Establish Performance Baselines Before Setting Thresholds
Every directory has its own normal. Give it two to four weeks of measurement first, long enough to catch a month-end close and at least one patch cycle, and track logon volume, LDAP bind time, replication lag and failed logons throughout.
Fixed thresholds still suit hard limits like disk space and time offset. Anything softer is a job for anomaly detection, which spots a gradual climb or a strange spike without anyone having to guess the right number in advance.
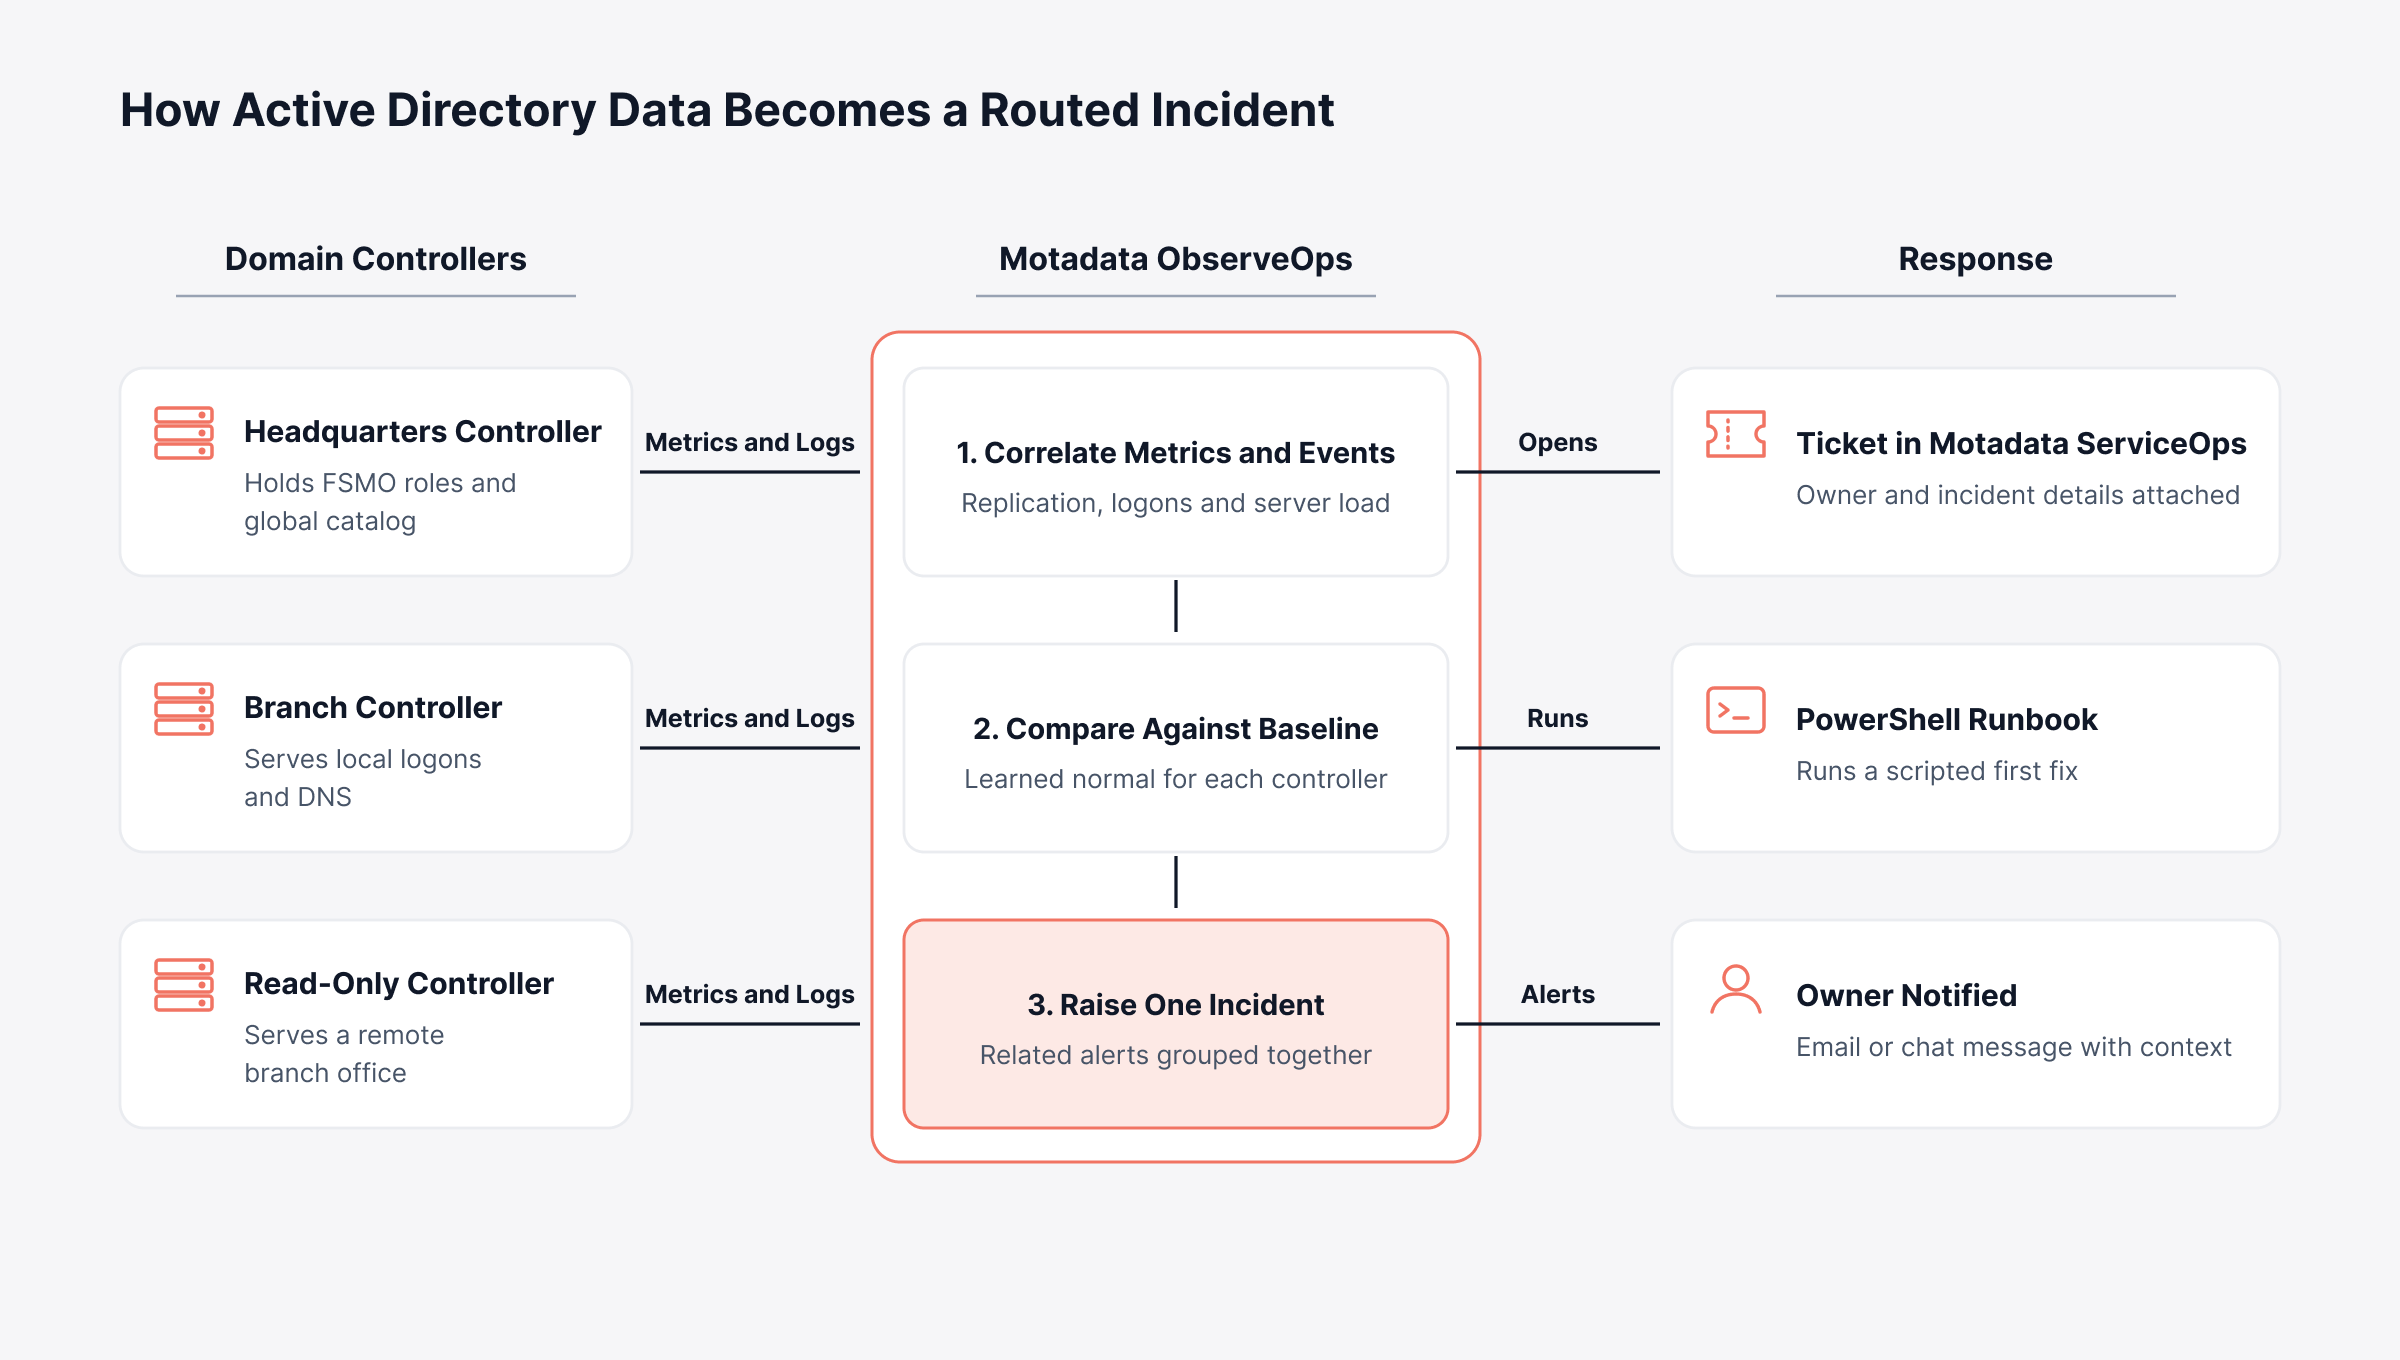
5. Route AD Alerts to the Right Owners with Context
Route each alert to whoever can fix it, with enough detail attached that they never have to go hunting before they start. Build routing around four rules:
Severity by impact: A stopped KDC on the PDC Emulator outranks a single failed logon
Grouping related alerts: One replication failure should open one incident, without dozens of partner alerts
Context in the alert: Domain controller, site, affected role and the related metric or event
Ticket creation: Directory incidents opened automatically in the service desk with an owner assigned
Grouping related alerts and suppressing duplicates keeps the important ones visible. For the tuning itself, see our guide on alert fatigue.
Data has to move cleanly from each domain controller to whoever fixes the problem. Read the flow below left to right, from first signal to response.
6. Test and Review Your AD Monitoring Regularly
An alert that has never fired is one nobody should fully trust, so test a few on purpose during a lab session or maintenance window:
Lock out a test account
Pause replication on a test controller
Add a test user to a monitored admin group
Then compare what arrived with what you expected, from the owner it reached to the detail it carried.
Thresholds drift out of date. Look at them every quarter, and again after a new site, a domain controller upgrade or a move to hybrid identity, since each of those changes what normal means. With that rhythm in place, the habits below keep the whole setup reliable.
What are the Best Practices for Monitoring Active Directory?
The best practices for monitoring Active Directory all serve one goal, which is leaving no blind spots: every domain controller watched, health and security read together, and enough history kept to investigate properly. Each of the five Active Directory monitoring best practices below supports that goal while problems are still cheap to fix.
1. Monitor Every Domain Controller Equally
Failures and attackers both find the controller nobody watches.
Include read-only and branch domain controllers in the same policies as headquarters
Alert when a domain controller stops reporting, since silence can mean failure or tampering
Recheck coverage after every domain controller promotion or demotion
2. Read Health and Security Signals Together
A single symptom can have a health cause or a security cause. Check both before deciding.
Correlate failed logon spikes with recent password policy or service account changes
Check replication status before treating a missing change as suspicious
Keep metrics and events for each domain controller on one timeline
3. Keep Directory Logs Long Enough to Investigate Incidents
Intrusions are often found weeks after they start. Short retention means the evidence is already gone.
Set retention to match compliance obligations and incident response needs
Store logs away from the domain controllers so a compromised server cannot erase them
Use log compliance reporting to produce audit evidence on a schedule
4. Treat Privileged Changes as Priority Alerts
Edits to admin groups and domain controller policies carry more risk than any other change.
Alert in real time on every membership change to privileged groups
Match each change against an approved change record
Review delegation and AdminSDHolder permissions every month
5. Extend Monitoring to Hybrid Identity and Entra ID
Many organizations sync on-premises accounts to Microsoft Entra ID. After that, an on-site directory fault can block cloud sign-ins too.
Track directory synchronization and password hash sync status, which runs every 30 minutes by default in Entra Connect Sync
Watch pass-through authentication agents or federation servers when cloud sign-ins depend on them
Include identity servers in your hybrid cloud monitoring dashboards
Leadership will eventually ask whether this is working. The answer needs numbers.
How do You Measure Whether Active Directory Monitoring Is Working?
Whether Active Directory monitoring is working shows up in a handful of numbers most IT organizations already collect. Mean time to detect, or MTTD, is one. Logon and lockout tickets are another, and so are the hours someone spends pulling audit evidence together.
The measures below translate monitoring activity into outcomes leadership can follow.
Measure | What it shows | Direction to aim for |
Mean time to detect directory incidents | How quickly problems surface after they begin | Shorter each quarter |
Mean time to resolve directory incidents | How long users and applications are affected | Shorter each quarter |
Logon and lockout tickets | Help desk effort spent on identity problems | Fewer each month |
Incidents reported by users first | Gaps in monitoring coverage | Close to zero |
Privileged changes without a change record | Whether access controls are holding | Every change matched to approved work |
Audit evidence preparation time | Effort spent proving who changed access | Scheduled reports in place of manual collection |
Report these numbers every quarter. They show leadership what monitoring saves, and they lead straight to the tooling question.
What Should You Look for in Active Directory Monitoring Tools?
Active Directory monitoring tools come in four types. Each covers part of the job. Most organizations run two of them together.
Coverage is where they differ most.
Tool category | Covers well | Typical gaps | Best fit |
Native Windows tools | On-demand health checks, replication tests, local event viewing | No continuous alerting, history or cross-server view | Small domains and troubleshooting |
AD auditing tools | Object-level change history, before-and-after values, compliance reports | Little coverage of performance, replication or wider infrastructure | Audit-heavy environments |
SIEM platforms | Security correlation across many log sources | Thin health and performance data, data volume costs | Security operations with dedicated analysts |
Unified observability platforms | Controller metrics, services, replication, event logs and dependent infrastructure together | Object-level change reports usually less detailed than auditing tools | IT operations that own uptime and response |
Security and operations people read the same domain controller logs and want different things from them. SIEM platforms hunt for attacks across many sources. Log management keeps the data searchable, and Active Directory health monitoring watches for faults.
Ask these questions of every vendor before choosing the best Active Directory monitoring tool for your environment:
Does it track replication status per partner and partition, or only domain controller uptime?
Can it show performance counters and event logs from one domain controller on the same timeline?
How does it learn baselines, and can thresholds differ by site or controller?
Can alerts open tickets and trigger scripted responses automatically?
What does it cost to keep a year of directory event logs?
How does it cover read-only domain controllers at remote sites?
Vague answers usually mean one more console for someone to watch.
Replace Point-in-Time AD Checks with Continuous Observability in Motadata ObserveOps
Native commands and point tools each cover a slice of Active Directory. The trouble that costs the most, slow logons, stalled replication and changes nobody approved, usually lives between those slices. Motadata ObserveOps puts directory health and the surrounding infrastructure in one platform, which means the data for an investigation is already collected by the time an incident starts.
With ObserveOps, you can work across every layer covered in this guide:
Directory performance: Track LDAP bind time, Kerberos and NTLM authentication rates, request queue delay and database cache behavior on each domain controller
Replication and roles: Watch replication status and error codes per partner, pending synchronizations and FSMO role status
Event logs in context: Collect Windows event logs through log management and read them beside server, DNS and network metrics
Smarter alerting: Apply fixed thresholds or predictive analytics that learn each controller's normal behavior
Faster response: Correlate related alerts, run PowerShell runbooks and open tickets in Motadata ServiceOps
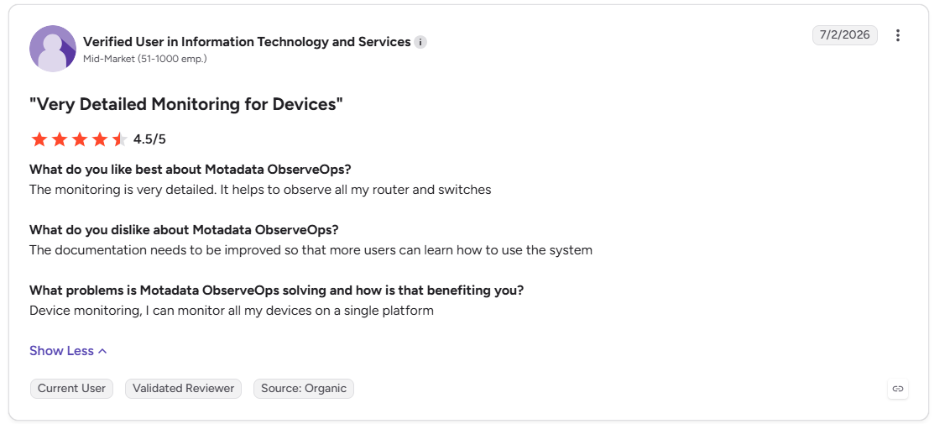
Organizations running ObserveOps day to day point to that level of detail. This is what one of our clients says about Motadata ObserveOps on G2:
Observability platforms have a limit worth stating plainly. Auditors sometimes want before-and-after values for every attribute edit. Dedicated AD auditing tools still handle that best, and some regulated organizations run one next to their monitoring.
Most IT operations groups have a costlier problem, though. It is the fault nobody spots until users start calling, and that is what continuous monitoring is for.
FAQs
What is the difference between AD and LDAP?
Active Directory is Microsoft's directory service that stores users, computers and policies and handles authentication for a Windows domain. LDAP is the open protocol applications use to query and update a directory, and Active Directory supports it alongside Kerberos and other protocols.
What is the best Active Directory monitoring tool?
The best tool depends on whether you need health monitoring, change auditing or security correlation. Organizations that own uptime usually want one platform covering domain controller metrics, replication and event logs, such as Motadata ObserveOps, and add a dedicated auditing tool only where compliance requires object-level history.
How often should you check Active Directory health?
Availability, replication and authentication metrics should be monitored continuously, with alerts in real time. Scheduled reviews still help, such as a weekly look at replication trends and lockout patterns and a quarterly review of privileged group membership, audit policy and alert thresholds.
Does Active Directory monitoring cover Microsoft Entra ID?
On-premises Active Directory monitoring covers domain controllers, and Microsoft Entra ID needs its own sign-in and synchronization monitoring. In hybrid environments, track sync health as well, because on-premises faults can block password changes and cloud sign-ins.
Can Active Directory alerts create help desk tickets automatically?
Yes, when the monitoring platform integrates with your service desk. Motadata ObserveOps can open tickets in Motadata ServiceOps from alerts, so a replication failure or stopped directory service reaches an owner with the details needed to start work.
Author
Poonam Lalani
Content Strategist
Poonam Lalani is a B2B content strategist and writer with a background in computer engineering and experience across enterprise technology domains, including AI, cloud, DevOps, data engineering, and IT operations. She specializes in creating research-driven content that simplifies complex ideas and supports product education, thought leadership, and business growth.