What is Zipkin and How does Distributed Tracing Speed Up Incident Resolution
If a checkout slows down or an API call fails, why can the cause stay hidden for so long while every service dashboard looks fine? One customer click in a microservices setup may hit a gateway and a few backend services first, then a queue or a database. Every hop logs its own events, yet none of those logs points back to the original request.
Distributed tracing was created to solve exactly this. Zipkin arrived early, as one of the first open-source tracers. Many engineers still pick it up first when they want to see where a request spends its time.
As the environment grows, Zipkin starts to show its limits, and that's usually when organizations look at a wider observability approach that includes microservices monitoring. In this blog, you will see what Zipkin does and how it works under the hood. We'll then compare it with Jaeger and OpenTelemetry and look at running costs, before covering when a full observability platform is worth the move.
What is Zipkin?
Zipkin is an open-source distributed tracing system that times each step of a request as it moves between services. Each instrumented service reports its timing data to the Zipkin server. Engineers then search and compare those traces through its web interface.
Once it's running, Zipkin gives you four things:
Request timelines: A waterfall view of every operation in one request, with start times and durations
Search and filtering: Traces filtered by service, operation name, tags, duration or time window
Dependency diagrams: A graph of which services call which, built from collected trace data
Pluggable storage: In-memory storage for testing, or persistent backends for production
The project began at Twitter, whose engineers needed to track down latency as their service count grew quickly. They modeled it on Dapper, the tracing system Google described in a 2010 paper, and released the code publicly in 2012. These days, the OpenZipkin community looks after the project, which is licensed under Apache 2.0.
Because it's a single Java server, a developer can get Zipkin running on a laptop in a few minutes. Low setup effort is a big part of why Zipkin tracing still turns up in tutorials and in plenty of Java codebases more than ten years on.
What is Zipkin Used For?
Zipkin is used to pinpoint where a request loses time, and where an error first shows up, as that request passes through many services. Timing data that would otherwise stay in separate applications ends up in one ordered record.
In practice, Zipkin distributed tracing tends to get used for five jobs:
Latency troubleshooting: Pinpointing the span that adds the most time to a slow request
Error localization: Seeing which service returned the first failure in a chain of calls
Dependency mapping: Confirming how services actually call each other in production, the same view a dependency map gives
Release validation: Comparing traces before and after a deployment to catch new slowdowns
Architecture discovery: Helping new engineers learn how a request flows through unfamiliar code
Tracing helps most with tail latency, the few requests that run much slower than the rest and that averages hide. Customers notice them, though. Line one of those traces up against a percentile view such as P99 latency, and the slow call is usually obvious.
Why does Zipkin Tracing Matter to Business Leaders?
Zipkin tracing matters to business leaders because a slow or failed request costs money every time it happens. With a trace in hand, the path from customer complaint to confirmed cause gets much shorter. Leaders usually see the payoff in four areas:
Shorter incidents: Faster isolation of the failing service lowers MTTD and the time customers wait for a fix
Protected revenue paths: Checkout, payments and login can be traced end to end, which ties business service monitoring to the transactions that earn money
Safer releases: Before-and-after trace comparisons show whether a deployment slowed a critical path
Better use of engineering time: Engineers spend less of each incident working out which group owns the problem
In an outage, the first questions from leadership are usually which service broke and who owns the fix. A trace answers both.
How does a Zipkin Trace Expose a Slow Checkout?
Say an online retailer's checkout goes through an API gateway first, then an order service that checks inventory and charges the card through a payment service. Shoppers say checkout feels slow. Yet CPU and memory look healthy on every host.
Open one slow checkout trace before changing any configuration, because the longest bar usually points to the fix. The waterfall below separates the payment call from the spans that are only waiting on it.
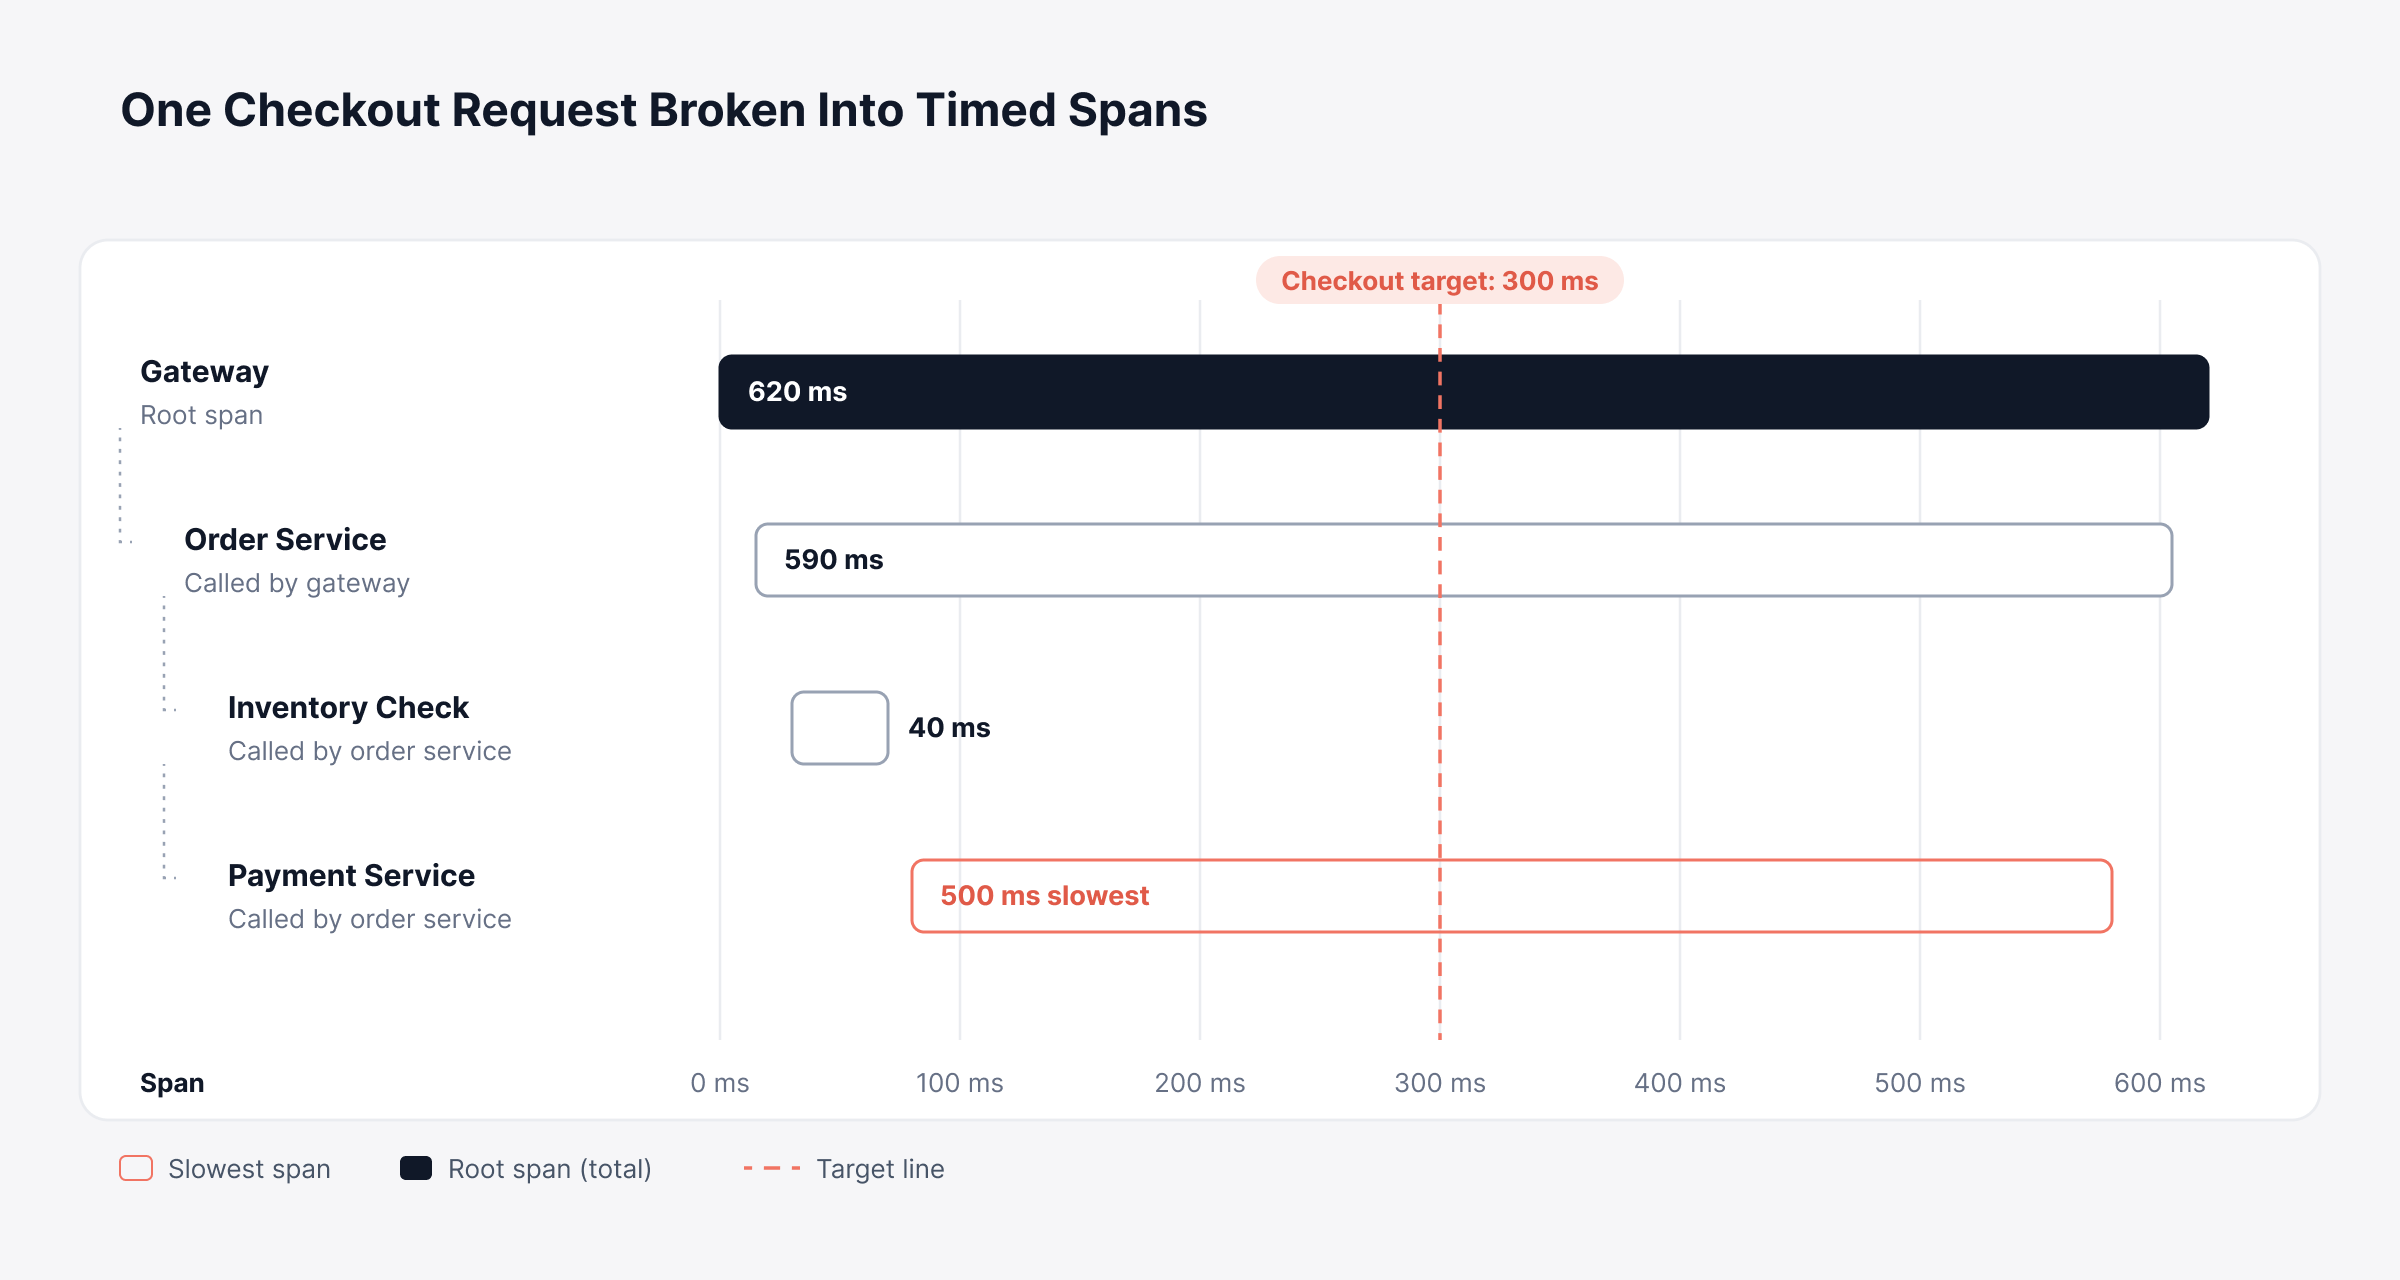
In this trace, the gateway and order spans look long only because they wait for the payment span to finish. The payment service is where the time goes, so that is where the investigation should start. How does Zipkin put a trace like this together?
How does Zipkin Work?
Zipkin works by stamping each request with a single trace ID, then timing every operation along the way as a span that a central server later reassembles. A tracing library inside each service handles the recording, so once it's installed, your own code barely changes. Nearly every distributed tracing tool is built on this same idea.
Tracing one request takes five steps:
A span starts: The tracer in the first service creates a trace ID and a span ID, then records a start timestamp
Context travels with the call: Before calling the next service, the tracer adds those IDs to the outgoing request as headers
Downstream services join the trace: Each receiving service reads the headers, keeps the same trace ID and opens a child span of its own
Spans report out of band: When an operation finishes, the reporter sends the completed span to Zipkin asynchronously, so the user's request never waits on tracing
The server assembles the trace: Zipkin's collector stores each span, and the UI groups spans by trace ID into one timeline
That fourth step is why Zipkin can run safely in production. Should the server slow down or go offline, the reporter holds or discards spans, and users keep getting served.
Most broken traces come down to one service that didn't pass the tracing headers along, so check propagation first. Below, you can follow which ID stays fixed and which one changes from hop to hop.
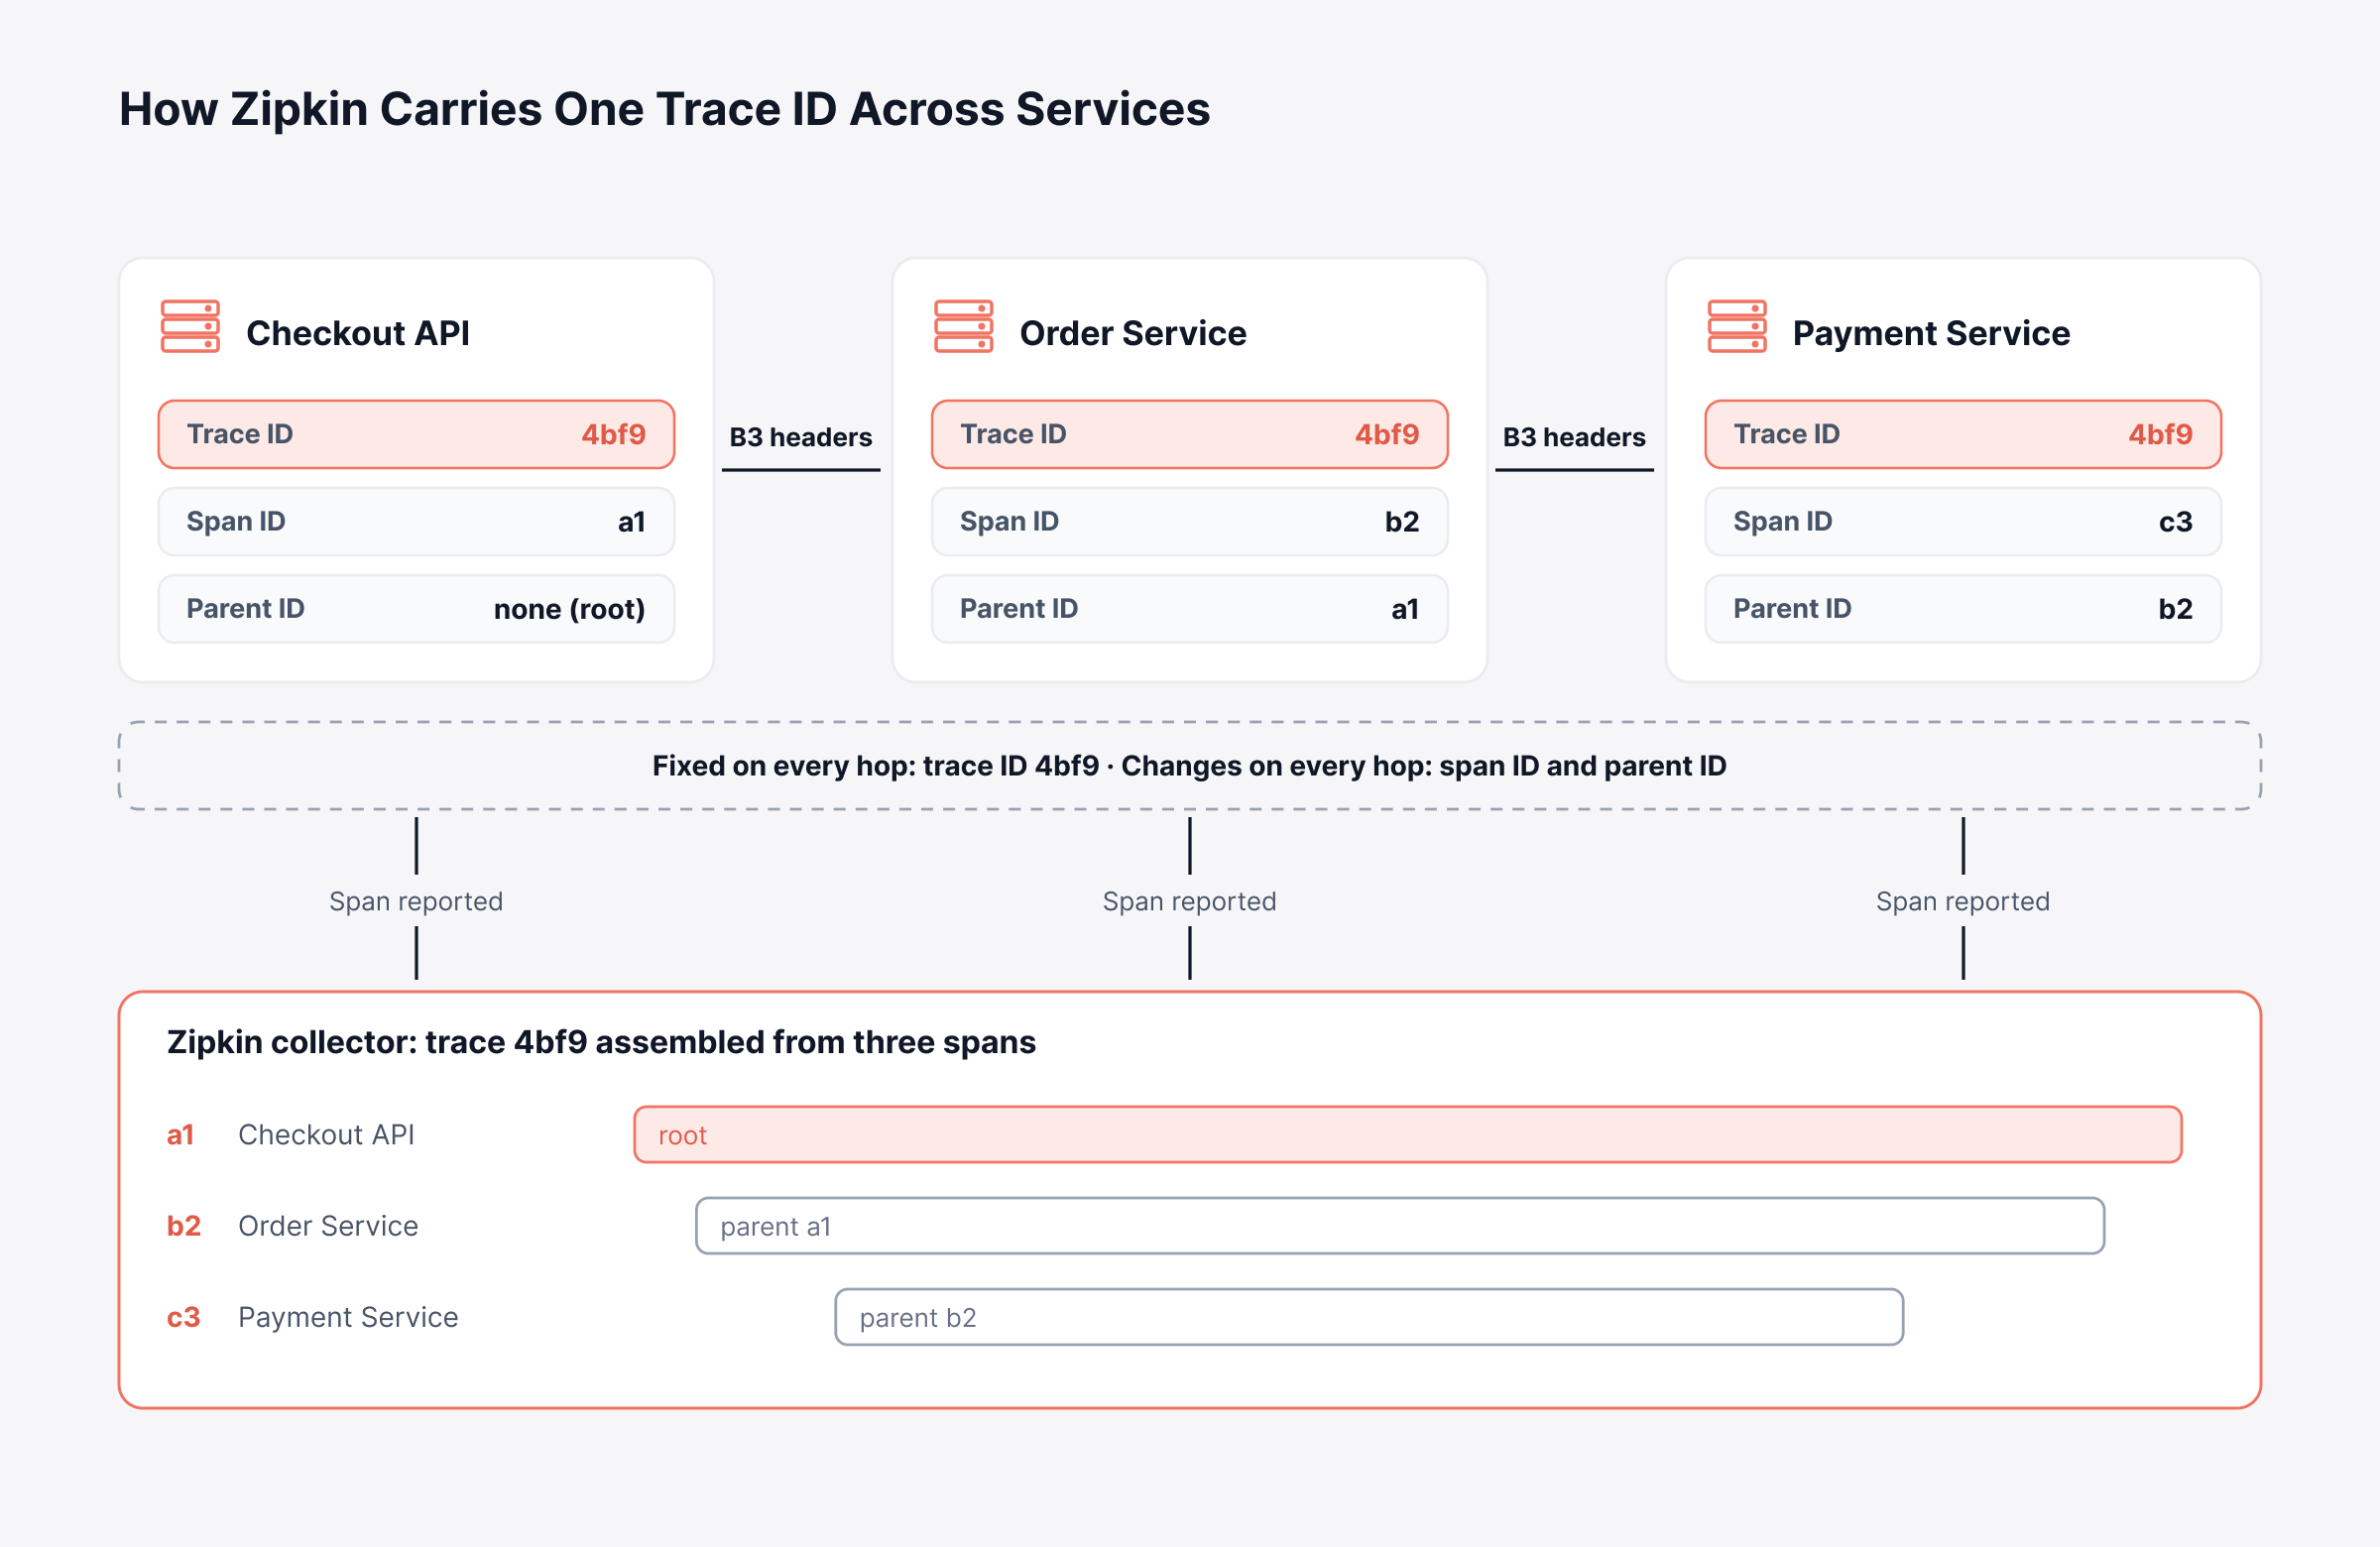
Those IDs travel in a handful of HTTP headers.
What are Zipkin B3 Headers?
B3 headers are the HTTP headers Zipkin uses to pass trace context from one service to the next. The name comes from BigBrotherBird, Zipkin's original internal name at Twitter.
Five headers carry that context:
Header | What it carries |
X-B3-TraceId | The ID shared by every span in one request |
X-B3-SpanId | The ID of the current operation |
X-B3-ParentSpanId | The ID of the span that made this call |
X-B3-Sampled | Whether this trace is recorded (1) or skipped (0) |
b3 | A single-header form that packs all of the above into one value |
Many current tracers, including the OpenTelemetry SDKs, can read and write B3 alongside W3C Trace Context, the vendor-neutral header standard most newer tracers use by default. That matters in mixed environments, where a single request might pass through an older Zipkin-instrumented service and a newly built one on the same trip.
What are the Core Parts of Zipkin Architecture?
Zipkin architecture has four parts, and only the first one, instrumentation, lives inside your own services. Out of the box, the server bundles the other three. That's why one container is enough for testing.
Before rolling Zipkin out in production, plan for each part separately, since each one grows and breaks differently. The diagram below separates what runs inside your applications from what runs on the Zipkin server.
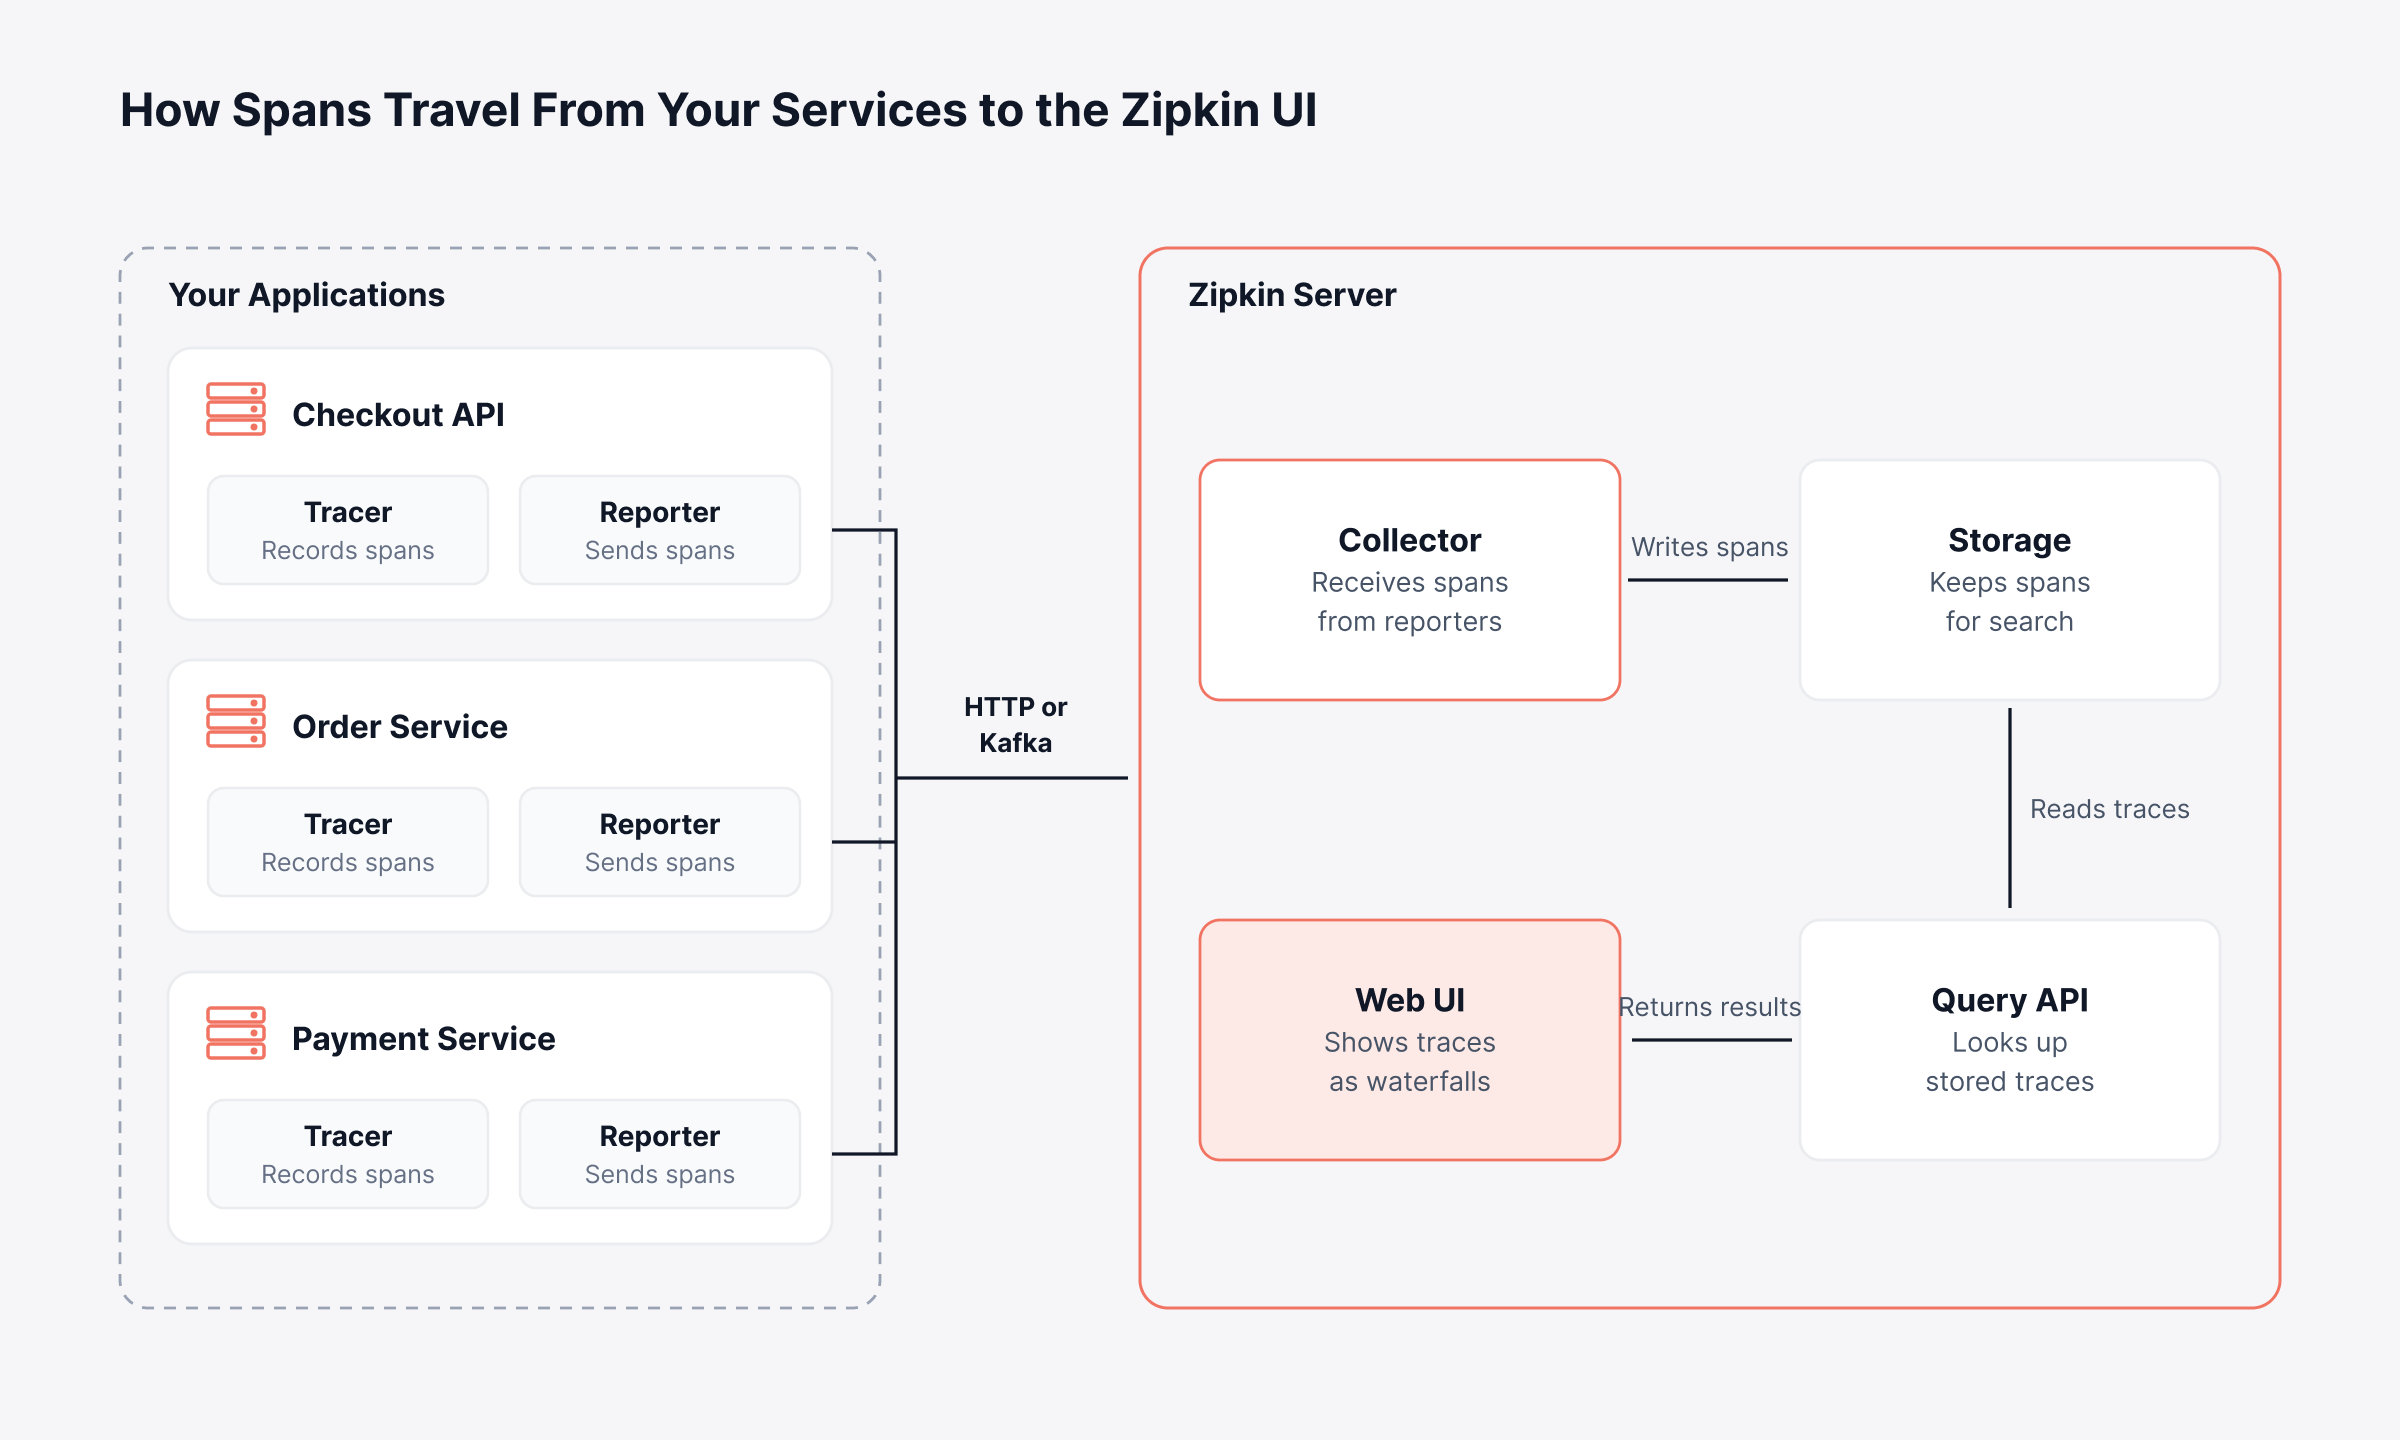
Each part is covered below, starting with the code that runs inside your services.
1. Zipkin Instrumentation and Reporters
Instrumentation lives in your application as a tracing library, creating spans and passing context to the next service. On the Java side that's usually Brave, and there are official or community libraries for Go, JavaScript, Python, C# and Ruby as well. Many web frameworks and HTTP clients get instrumented automatically, so you rarely change much code.
Within that library, the reporter gathers finished spans into batches and sends them off. It runs in the background with a fixed-size buffer, which means a busy or unreachable Zipkin server won't hold up your application.
2. Zipkin Transport Options
Every span has to travel from a service to the collector somehow, and the transport handles that trip as the first leg of a tracing telemetry pipeline. Most setups start with HTTP, posting spans to /api/v2/spans on port 9411.
Once span volume climbs, a lot of deployments move to Kafka, since a streaming platform can queue spans and ride out traffic spikes. RabbitMQ and ActiveMQ are supported too. gRPC works as well, and recent releases added Apache Pulsar.
3. Zipkin Collector and Storage Backends
Incoming spans land at the collector, which validates and indexes each one before writing it to storage. After that, retention and search speed depend on the storage you picked. So does the amount of upkeep.
Storage is the setup decision that's hardest to reverse, so settle it before go-live:
Storage option | Best suited to | What to plan for |
In-memory | Local testing and demos | All data is lost on restart |
MySQL | Small, low-volume setups | Legacy option with limited scale |
Cassandra (distributed database) | High write volume and long retention | A separate job to build the dependency graph |
Elasticsearch or OpenSearch | Environments already running a search cluster | A separate job to build the dependency graph, plus index sizing |
That separate job is called zipkin-dependencies, and it runs on a schedule to work out which services called which. Skip it, and the dependency diagram stays empty even though traces display normally.
4. Zipkin Query API and Web UI
Traces come back out through the query API, a JSON interface that the web UI calls behind the scenes. Engineers use the UI on port 9411 to look up a trace and open it as a waterfall. There's also a dependency diagram that works much like a service map.
Zipkin's UI and API ship without any login screen or access control. If someone can reach port 9411, every trace is open to them. Put an authenticating proxy in front before the server is reachable from a shared network.
What are Traces, Spans and Trace IDs in Zipkin?
A trace in Zipkin is everything that happened to one request, and a span is a single timed piece of it, such as an HTTP call or a database query. Because every span carries the shared trace ID and its own span ID, the UI can line them up in the right order.
You'll find this vocabulary throughout the Zipkin UI and API:
Term | Meaning in Zipkin |
Trace | Every span that belongs to one request, grouped by a shared trace ID |
Span | One operation with a name, start time and duration |
Trace ID | A 64-bit or 128-bit ID shared across the whole request |
Span ID | A unique ID for a single operation |
Parent ID | The span that triggered this one, which creates the tree structure |
Span kind | The role of the span: client, server, producer or consumer |
Tags | Key-value details such as HTTP route, status code or error message |
Annotations | Timestamped events inside a span, such as a retry or a cache miss |
Endpoints | The local and remote service names and addresses for the call |
Zipkin stores timestamps and durations in microseconds. Even very fast operations stay visible in a waterfall or flame chart view. Engineers coming from other tracers are sometimes surprised that both sides of a remote call can report under one span ID, which Zipkin then shows as a single merged span.
How does Zipkin Sampling Work?
Sampling in Zipkin controls which requests are traced at all. The first service makes that call and passes it downstream in the sampled flag. As a result, every service on the path keeps or drops its part of the trace together.
Which approach fits depends on what you can afford to miss:
Higher rates: Better coverage of rare errors, with more storage and network cost
Lower rates: Less overhead, with a higher chance that an intermittent failure goes unrecorded
Rate limiting: A fixed number of traces per second, which keeps cost predictable during traffic spikes
Out of the box, Spring Boot traces 10% of requests. It's a reasonable place to start, and you'll likely tune it after watching production traffic for a while. With the rate decided, you can start an actual server.
How do You Install and Run Zipkin?
To install and run Zipkin, use either the official Docker image or the standalone Java JAR, and the server comes up on port 9411 in both cases. For a first test, Docker Zipkin is less work. You only need Docker on the machine.
For a quick local Zipkin tutorial, start with one of these commands:
Method | Command | What it tells you |
Docker | docker run -d -p 9411:9411 openzipkin/zipkin | Starts Zipkin with in-memory storage on port 9411 |
Docker, lighter image | docker run -d -p 9411:9411 openzipkin/zipkin-slim | Starts a smaller image with a reduced feature set |
Java, step 1 | curl -sSL https://zipkin.io/quickstart.sh -o quickstart.sh | Downloads the official quickstart script |
Java, step 2 | bash quickstart.sh | Fetches the latest Zipkin server JAR file |
Java, step 3 | java -jar zipkin.jar | Runs the server, which needs Java 17 or later |
Docker with persistent storage | docker run -d -p 9411:9411 -e STORAGE_TYPE=elasticsearch -e ES_HOSTS=http://10.0.0.10:9200 openzipkin/zipkin | Keeps traces in a search cluster across restarts |
When the server is running, the UI is at http://localhost:9411/zipkin/. Next, point your services' reporters at that host and send a few requests. Traces should appear within seconds.
Going from a test server to production takes more planning, particularly on shared platforms that already depend on Kubernetes monitoring. Ahead of go-live, work through:
Persistent storage: A backend sized for your span volume and query load
Retention policy: How many days of traces to keep, and who owns the disk cost
Access control: An authenticating proxy in front of the UI and API
Dependency job: A scheduled zipkin-dependencies run when using Cassandra or Elasticsearch
Server health: Alerts on the Zipkin server's own health and metrics endpoints, so a collection outage does not go unnoticed
How does Zipkin Work With Spring Boot?
Zipkin works with Spring Boot as the backend that collects and shows traces, and a tracing library inside the app produces the spans. So when people ask what is Zipkin in Spring Boot, the answer is that destination role, whichever library sends the data. Which library you use depends on your Spring Boot version.
On Spring Boot 2, most apps used Spring Cloud Sleuth to write trace IDs into logs and report spans to Zipkin. Sleuth stops at Spring Boot 2, though. Newer applications use Micrometer Tracing, Spring's tracing abstraction, with either the Brave bridge or the OpenTelemetry bridge, and then send spans to Zipkin.
What is the Difference Between Zipkin and Sleuth?
Tutorials paired Zipkin and Sleuth so often that the two are easy to confuse. In fact, questions such as what is Zipkin and Sleuth, or Zipkin vs Sleuth, involve two separate layers:
Aspect | Spring Cloud Sleuth | Zipkin |
Role | Instrumentation library | Tracing backend server |
Where it runs | Inside each Spring application | As a separate service |
What it does | Creates spans, adds trace IDs to logs, propagates headers | Collects, stores and displays spans |
Current status | Spring Boot 2 only, replaced by Micrometer Tracing | Actively maintained with regular releases |
A typical Zipkin Spring Boot setup on Spring Boot 3 takes three changes:
Add Actuator and a tracing bridge: Spring Boot Actuator, the production-readiness module, plus Micrometer Tracing with the Brave or OpenTelemetry bridge
Add a span reporter: The dependency that sends finished spans to Zipkin's span endpoint
Set the endpoint and sampling rate: Point the application at the server on port 9411, and raise the sampling probability above the default while testing
Now that OpenTelemetry has deprecated its Zipkin exporter, Spring services are safer on the Brave path or on OTLP export. And for broader Java application monitoring, traces need context from the JVM itself, such as garbage collection pauses.
How is Zipkin Different from Logging and Metrics?
Zipkin differs from logging and metrics because it follows a single request across many services. Logs stay inside one service and describe what it did, and metrics follow health over time. You need all three for observability, because none of them can stand in for the others.
Side by side, the three signals look like this:
Area | Traces (Zipkin) | Logs | Metrics |
Main purpose | Follow one request end to end | Record what happened inside a service | Track health and trends over time |
Shows service-to-service timing | Yes | Only when trace IDs are logged | No |
Typical data | Spans with durations and tags | Timestamped text or structured events | Counters, gauges and histograms |
Common open-source example | Zipkin | Fluentd | Prometheus |
Best first question | Where did this request slow down? | What exactly failed? | Is something wrong right now? |
Alerting | Not included | Depends on the log tool | Core use case |
A metric alert usually flags the problem first. From there, the trace narrows it to one service, and logs supply the cause. Give all three the same trace ID and a responder can jump between them without matching timestamps manually, which makes the logs vs metrics debate far less important.
What is the Difference Between Zipkin and Jaeger?
The main difference between Zipkin and Jaeger comes from their age, since each one was designed around the tracing standards of its time. Zipkin is a compact Java server with its own span format. Jaeger, which came later and is written in Go, now centers on OpenTelemetry under the Cloud Native Computing Foundation (CNCF).
Both tools cost nothing and are open source, so the Jaeger vs Zipkin decision rests on the differences below:
Area | Zipkin | Jaeger |
Origin | Built at Twitter, open-sourced in 2012 | Built at Uber, open-sourced in 2017 |
Language | Java | Go |
Governance | OpenZipkin community | CNCF graduated project |
Native data format | Zipkin JSON with B3 propagation | OpenTelemetry (OTLP), with Zipkin format accepted |
Deployment | One server for collector, storage and UI | Components built on the OpenTelemetry Collector |
Sampling | Set in each application's tracer | Application-side, plus remote and adaptive strategies served centrally |
Storage | In-memory, Cassandra, Elasticsearch, MySQL | In-memory, Badger, Cassandra, Elasticsearch, OpenSearch |
Best fit | Java-heavy systems and simple setups | OpenTelemetry-first, cloud-native environments |
In most cases, the Zipkin vs Jaeger call depends on how much infrastructure you're prepared to run and which instrumentation standard you've already picked. If you want few moving parts and your services already use B3, Zipkin fits well. Jaeger tends to win once OpenTelemetry is your standard and collection needs to scale across clusters.
How does Zipkin Relate to OpenTelemetry?
Zipkin relates to OpenTelemetry as one possible backend for the trace data that OpenTelemetry produces. In other words, OpenTelemetry creates the data and Zipkin is one place to look at it. That's why a straight Zipkin vs OpenTelemetry comparison can be misleading, since they handle different layers of tracing.
The split looks like this:
Area | Zipkin | OpenTelemetry |
What it is | A tracing backend with storage and UI | A vendor-neutral standard with SDKs and a Collector |
Signals | Traces | Traces, metrics and logs |
Storage and UI | Included | Left to whichever backend you choose |
Governance | OpenZipkin community | CNCF |
The Zipkin project dates back further than OpenTracing, an earlier tracing API that eventually merged into OpenTelemetry. In December 2025 the Zipkin OpenTelemetry link changed again, as OpenTelemetry deprecated its Zipkin exporter specification because few people used it. Under the deprecation notice, current exporters still get security fixes until at least December 2026.
If you still run Zipkin, there are three practical ways forward:
Send OTLP straight to Zipkin: Zipkin's ingestion add-on for OTLP, the OpenTelemetry Protocol, accepts OpenTelemetry data over HTTP and converts it into Zipkin spans
Route through the OpenTelemetry Collector: Applications export OTLP to the Collector, which forwards spans to Zipkin or to any other backend
Keep native Zipkin instrumentation: Java services on Brave keep reporting in Zipkin format while newer services adopt OpenTelemetry
Is Zipkin Still Used?
Yes, Zipkin is still used and still maintained, with the OpenZipkin project shipping regular releases through 2026. It remains common in Java and Spring Boot systems, in training material, and as a compatible format, since many tracing backends, including the OpenTelemetry Collector, accept spans in Zipkin format.
That said, its role has changed. Many new projects choose OpenTelemetry for instrumentation before picking a backend, which means Zipkin is compared with broader platforms from day one. Zipkin remains a good fit when:
Scope is narrow: You need request tracing for a contained set of services
The stack is Java-centric: Brave and Spring integrations are mature and well documented
Budget is tight: The software is free, and a single server handles modest trace volumes
The goal is learning: Few tools show tracing concepts as plainly as Zipkin does
What are the Limitations of Zipkin?
Zipkin's main limitations come from handling only one signal and leaving the operating work to you. Traces look good in it, yet they stay disconnected from metrics, logs and infrastructure, and there's no alerting.
In a pilot, you'll hardly notice these gaps. During a production incident, they're hard to ignore:
Traces only: No built-in metrics, logs or host health, so engineers switch tools to learn why a span was slow
No alerting: Traces are displayed on request, and nobody is notified when latency or errors rise
No built-in access control: The UI and API need a separate proxy before they can be exposed safely
Storage is your job: Capacity planning, retention, index tuning and backups fall on whoever runs the server
Extra job for dependency graphs: Cassandra and Elasticsearch setups need a scheduled aggregation job to keep the dependency view current
Sampling blind spots: At low sampling rates, rare or intermittent failures may never be recorded
Coverage gaps: Any service, queue or third-party call without instrumentation splits the trace into fragments
Zipkin still does its core job well. It shows where a request slowed down, though the reason usually lies in other data. Measure it against the four golden signals of latency, traffic, errors and saturation, and you can see how much ground a tracer covers alone.
What does it Cost to Run Zipkin in Production?
Zipkin costs nothing to license in production, but the hardware and staff time behind it rise steadily with trace volume. A pilot rarely exposes those costs. They tend to surface once tracing spreads from a few services to the whole platform.
Here is where that money tends to go:
Compute and storage: Servers or clusters sized for peak span volume, plus disk for every day of retention
Operations: Upgrades, index management, backups and the scheduled dependency job
Security: An authenticating proxy, network controls and access reviews for trace data that may include customer details
People: Engineering hours spent running the tracer, which come out of product and reliability work
Tool overhead: Separate observability tools for logs, metrics and alerting, each with its own setup and upkeep
A regional retailer might begin with Zipkin on a handful of services and, a year on, have several dozen instrumented without ever buying a license. By then, though, its platform group is running a search cluster and a scheduled dependency job, plus deciding how long traces are kept. Whether that's worth it depends on how much faster incidents now get resolved.
When Should You Move Beyond Zipkin to a Full Observability Platform?
You should move beyond Zipkin to a full observability platform once the hours lost switching between tools during incidents cost more than a free tracer saves. It rarely happens all at once. As the service count and the on-call rotation grow, a single revenue-critical transaction can end up depending on dozens of calls.
The signs tend to look like this:
Slow spans with no clear cause: A trace shows the payment call took 500 ms, yet the reason lives on a database host or a network path
Repeated context switching: Responders open the tracer, the log tool and the metrics dashboard separately, then line up timestamps manually
Rising operating cost: Running and scaling trace storage starts to compete with product work for engineering hours
Leadership visibility gaps: Managers ask which customer-facing services are at risk, and traces alone cannot answer
Return to the checkout example. Zipkin points at the payment service, yet nobody has touched that code in weeks. Line the trace up with host metrics, though, and the payment database server shows a disk latency spike at that same moment, which points root cause analysis straight at storage.
This is where an observability platform that treats traces as one signal among several changes the outcome. Motadata ObserveOps APM is built on OpenTelemetry standards and records each service call, database interaction and downstream dependency as a span, with code-level visibility into slow operations. From any trace, responders can move to:
Related logs: Log correlation from a span to the log events behind it
Database activity: Database correlation for the queries a slow span depends on
Service dependencies: A live service map generated from trace data
Host health: Infrastructure metrics for the server behind the service that slowed down
Keeping those signals in one place is what users tend to value, and this is what one reviewer says about Motadata ObserveOps on G2: 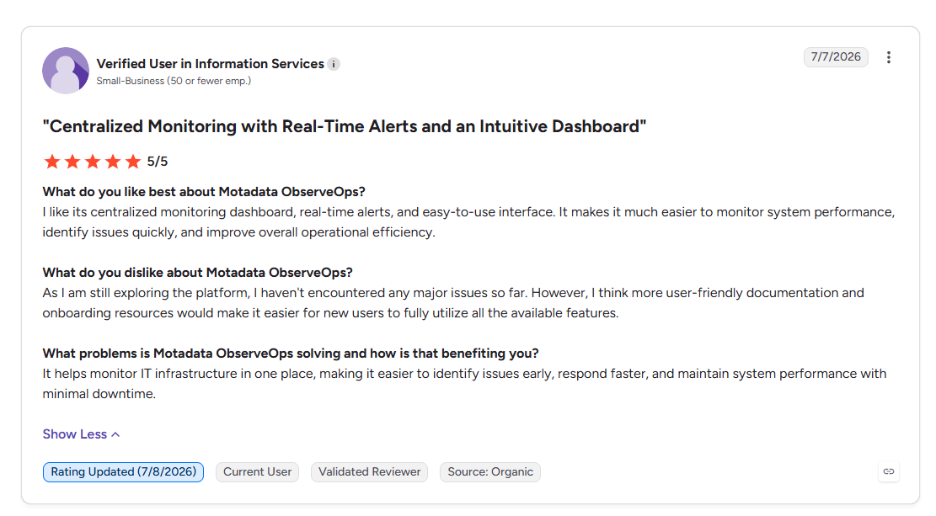
Connect Every Slow Span to Its Root Cause with Motadata ObserveOps
Zipkin earned its place in the history of distributed tracing. It is free, well understood and still one of the quickest ways to see how a request moves through microservices. A standalone tracer will always cost less to start than a full platform, and for a small, Java-centric system it may be all you need.
The gap appears once incidents involve databases, hosts and networks as well as code. A trace shows the slow span, and the cause usually lives somewhere the tracer cannot see. Motadata ObserveOps addresses that in three concrete ways:
Portable instrumentation: OpenTelemetry-native monitoring, so instrumentation stays vendor-neutral
One agent: A single MotaAgent auto-instruments supported frameworks across Java, .NET, PHP, Node.js, Python and Go
One workspace: Traces open into logs, host metrics and database detail without switching tools
If your traces already tell you where requests slow down, the next step is a view that also explains why. Bring tracing into unified observability with full application performance monitoring, and every slow span arrives with the context needed to fix it.
FAQs
Is Zipkin free to use?
Yes. Zipkin is open-source software released under the Apache 2.0 license, so there is no license fee. The cost comes from the servers, storage and engineering time needed to run it reliably at production scale.
What port does Zipkin use?
Zipkin uses port 9411 by default for both its web UI and its span collection API. Applications send spans to the /api/v2/spans path on that port, and the port can be changed through server configuration if 9411 is already taken.
Can Zipkin receive OpenTelemetry data?
Yes. Zipkin can accept OpenTelemetry traces through its OTLP ingestion add-on, or through the OpenTelemetry Collector forwarding spans in Zipkin format. Since OpenTelemetry deprecated its Zipkin exporter, OTLP is the safer long-term path for new services.
Which programming languages does Zipkin support?
Zipkin supports Java through the Brave library, and official or community libraries cover Go, JavaScript, Python, C#, Ruby and others. OpenTelemetry SDKs can also send data to Zipkin, which extends coverage to most modern languages.
Do you still need Zipkin if you use an APM platform?
Usually not, because a full APM platform collects, stores and displays traces itself. Motadata ObserveOps, for example, works with OpenTelemetry instrumentation and links traces to logs, metrics and database activity, so a separate tracing backend becomes optional.
Author
Poonam Lalani
Content Strategist
Poonam Lalani is a B2B content strategist and writer with a background in computer engineering and experience across enterprise technology domains, including AI, cloud, DevOps, data engineering, and IT operations. She specializes in creating research-driven content that simplifies complex ideas and supports product education, thought leadership, and business growth.