What Is Security Log Management, and Why Does IT Security Depend on It?
Most IT teams collect far more log data than anyone can read. The evidence of an intrusion is usually sitting in it, unnoticed.
Logs arrive from every server, firewall, application, and cloud service you run. They come in different formats, with different timestamps, at a volume that defeats manual review. So the signal exists, and nobody sees it in time.
Security log management closes that gap.
The cost of leaving it open keeps climbing. According to IBM’s 2026 Cost of a Data Breach Report, the global average cost of a data breach at USD 4.99 million in 2026, a record. Higher detection and escalation costs were named as one driver.
In this blog, you will see:
The five log types that carry the most security signal, and what each one catches.
Five reasons log management changes what a security team can actually see.
The six stages every log passes through, from collection to disposal.
Where log management ends and SIEM begins.
The practices that survive once log volume grows past what a person can read.
By the end you will know which logs to collect first, what to do with them once they land, and where most teams lose the thread.
What Is Security Log Management?
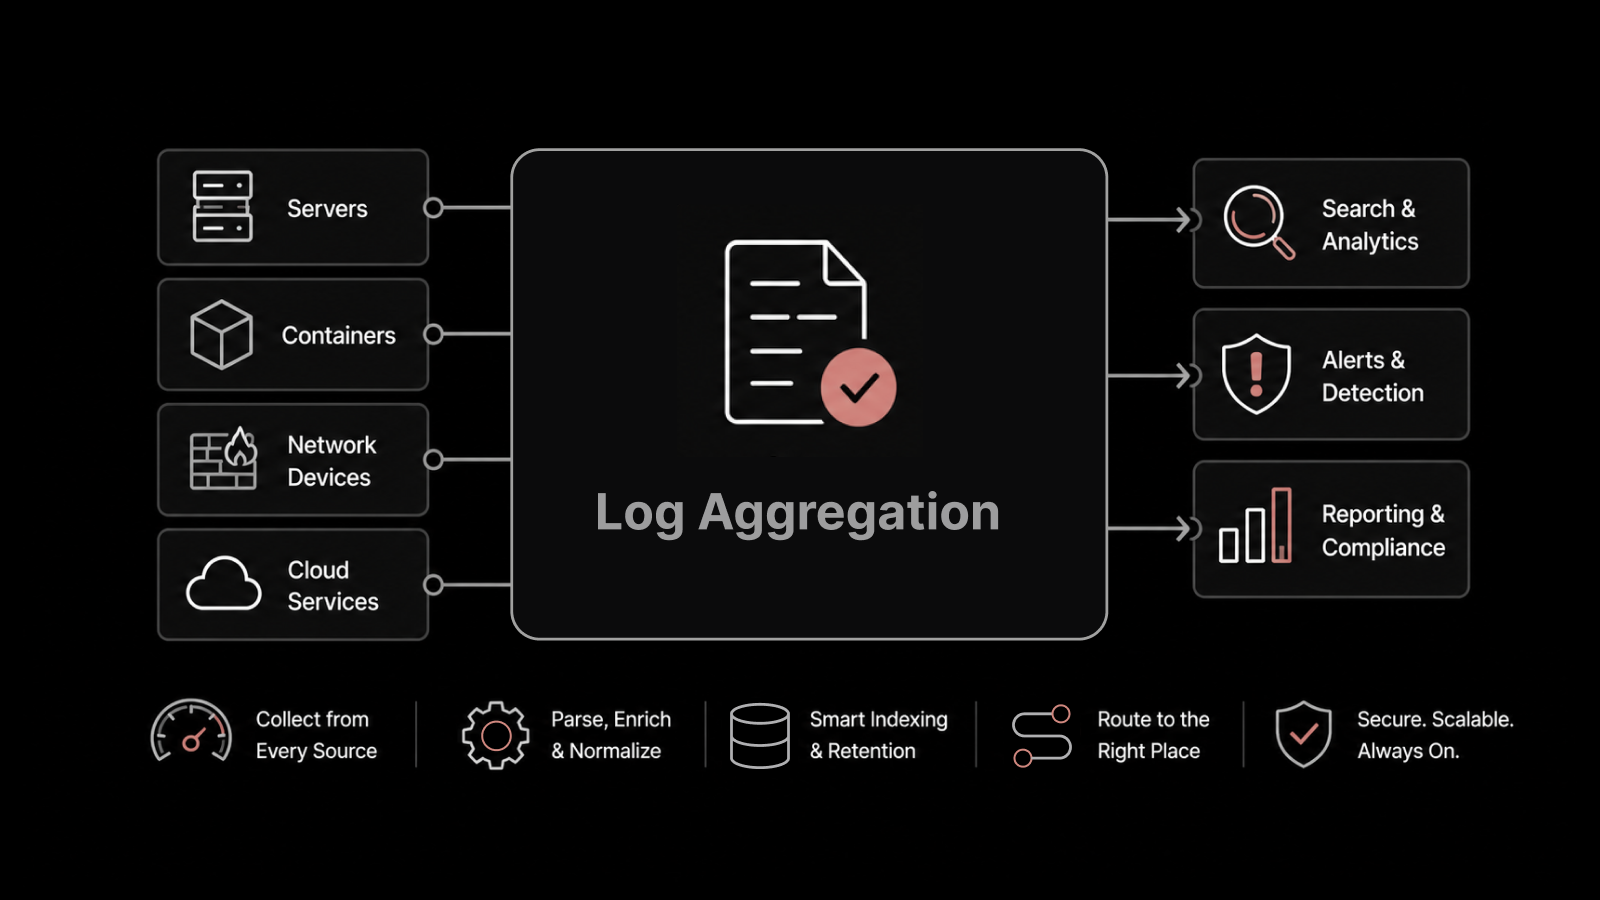
Security log management is the practice of collecting, normalizing, storing, analyzing, and retaining log data from across an IT environment. It exists so a team can detect threats, investigate incidents, and meet compliance requirements.
You will see the same work called IT log management, or log management in cyber security. The scope does not change.
The logging half is already handled for you. Every server, firewall, application, and cloud service writes down what happened on it, whether anyone asked or not. The management half is what makes those records usable. That means one destination, one shared format, and storage that an analyst can query in seconds.
Skip that second half and you still have logs. They sit in two hundred places in six formats. During an incident, that is much the same as having none.
The Five Types of Security Logs
Security logs come from five main sources, and each source catches a different stage of an attack. Here is what each type covers.
Log Type | Where It Comes From | What It Catches |
Authentication logs | Directory services, VPNs, SSO providers | Failed logins, password changes, account lockouts |
System logs | Windows and Linux hosts, hypervisors | Service starts, configuration changes, privilege escalation |
Network and firewall logs | Firewalls, routers, DNS, proxies | Blocked connections, odd destinations, traffic spikes |
Application logs | Business applications, APIs, databases | Unusual queries, failed transactions, injection attempts |
Cloud and audit logs | AWS, Azure, Microsoft 365 | API calls, permission grants, new resources |
Authentication and firewall logs are where I would start if you are building this from nothing. They cover the two things an attacker has to do, which is get in and then talk to something outside. Network log management covers that second half.
Cloud audit logs are the ones we watch teams add last and then wish they had added first. A permission grant in Microsoft 365 leaves no fingerprint on any server you own.
What Does a Security Log Actually Look Like?
A security log is a timestamped record of one event, with the actor, the target, and the outcome attached. Three examples show the shape.
Failed Windows logon, Event ID 4625: the entry names the target account, the source IP address, and a failure reason such as a bad password. Five of these in a minute from one address is a brute-force attempt.
Linux privilege escalation in auth.log: the entry names the user, the terminal, and the command they ran as root. An account escalating at 3 a.m. that has never done so before is worth a look.
AWS CloudTrail API call: the record carries the caller identity, the API name such as CreateAccessKey, and the source IP. A new access key created outside your deployment pipeline is a common persistence move.
What Are the Benefits of Log Management in IT Security?
The importance of log management in IT security rests on one fact. Logs are the only record of what actually happened, rather than what your controls were meant to prevent. The benefits of log management fall into five areas.
1. Logs Are Where Attacks Show Up First
Attacks leave marks in log files before they leave marks anywhere else. A brute-force attempt is a run of failed authentication events. Lateral movement is one account appearing on hosts it has never touched. Data theft is an outbound transfer at a volume and an hour that do not fit.
According to Verizon's 2026 DBIR found that 31% of breaches now start with exploitation of a software vulnerability. That overtook credential abuse as the most common way in.
Exploits are noisy; They throw crash entries, unexpected process spawns, and web server errors. All of it lands in logs most teams collect and never open.
Continuous log monitoring turns those entries into something a person sees the same day. That is the mechanism behind any real reduction in mean time to detect (MTTD).
2. Investigations Need a Timeline You Can Trust
After an incident the questions are always the same. When did this start, which systems were touched, what did the attacker take, and how did they get in.
You answer those from logs or you do not answer them. A centralized, time-synchronized record lets you rebuild the sequence hour by hour. It also cuts response time, because nobody hunts for the data before they can use it. Without one, the investigation turns into interviews and guesswork.
We have sat in enough post-incident reviews to notice the pattern. The teams that recover fastest already had ninety days of searchable history before anything went wrong.
3. Compliance Auditors Ask for Evidence, Not Assurances
Auditors want records. PCI DSS, HIPAA, SOC 2, and GDPR all expect the same three things. Log access to sensitive systems, hold those records for a set period, and show that somebody reviews them.
PCI DSS is the blunt one. It asks for twelve months of audit history, with the most recent three months ready for immediate analysis. That is a storage decision and a retention policy. It costs far less to make on day one than during an audit week.
4. Correlation Turns Isolated Events Into an Attack Chain
One failed login is noise. One failed login, then a success from another country, then a new admin group membership, then a large file transfer, is an attack chain.
No single log source shows you that. It appears only when events from your directory service, your endpoints, and your firewall sit in one timeline and get compared automatically.
That comparison is what manual review cannot do at scale. It is also where log management starts working as a detection control.
5. Log Data Doubles as Operational Insight
The same records that catch attacks also show you why an application is slow. Error rates, failed jobs, timeouts, and disk warnings all live in the logs your security team already collects.
Teams that treat log management as a security-only tool end up paying twice. They buy a security log platform, then buy an operations one. Running both jobs off a single dataset is usually cheaper and always faster to search.
How Does Security Log Management Work?
IT logging produces the raw material. Every log that reaches a security team then passes through six stages. Most log management problems trace back to one of them being skipped.
Collection: Agents, syslog forwarders, and API pulls gather log data from hosts, network gear, applications, and cloud services. Coverage gaps get created here, and they are hard to spot later.
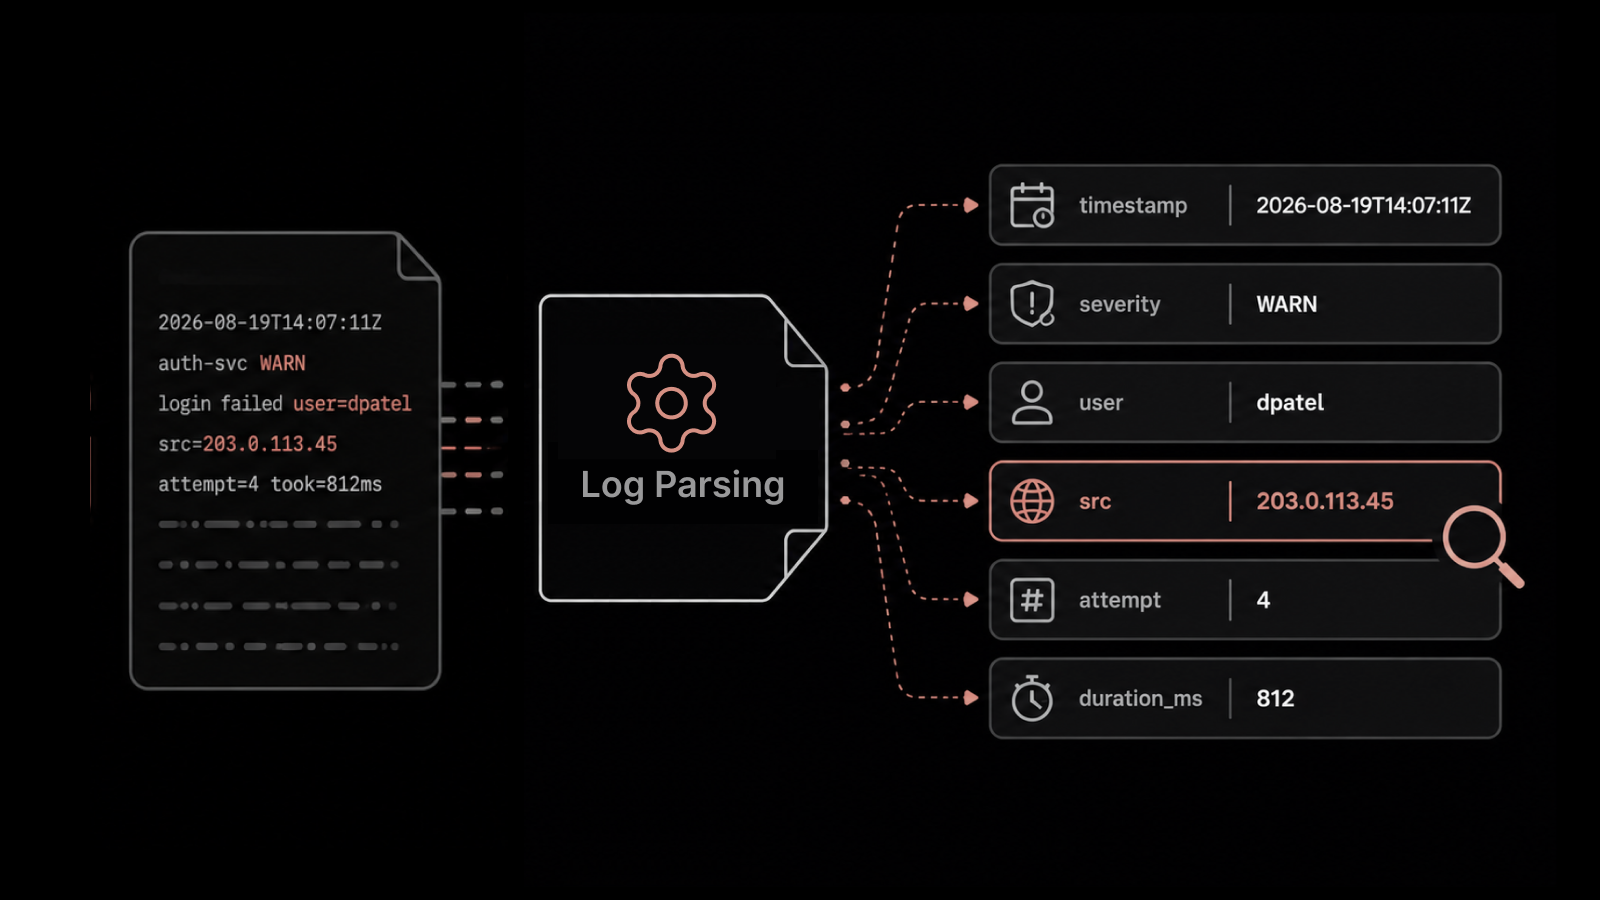
Normalization: Raw entries arrive in different formats with different timestamps. Parsing rewrites them into common fields. A search for one username then returns results from every source at once.
Storage: Logs land in an indexed store sized for the volume and the retention window. Hot storage keeps recent data fast to query. Colder tiers hold the rest at lower cost.
Analysis: Analysts search, filter, and correlate. Pattern matching and anomaly detection run continuously, flagging whatever looks unlike the last thirty days.
Alerting: Matches raise an alert carrying enough context to act on. Tuning happens at this stage, and it never really stops.
Retention and Disposal: Records are held for the period the regulation requires, then deleted on schedule. Keeping logs past your own policy creates a liability of its own.
How Is Security Log Management Different From SIEM?
Security log management collects, stores, and makes log data searchable. A SIEM adds a correlation and detection layer on top of that data, with built-in rules, threat intelligence feeds, and case management for analysts.
The practical difference shows up after the logs land. Log management answers what happened on this host last Tuesday. A SIEM tries to tell you something is happening right now and that it deserves attention.
Most of the teams we talk to need the first before the second. A SIEM fed by patchy, unnormalized logs produces confident alerts about half a picture. That is worse than no alert at all. The gap between SIEM and log management matters most at exactly that point.
What Are the Challenges of Security Log Management?
Security log management runs into four challenges, and every one of them gets worse as an environment grows.
1. The Volume Grows Faster Than the Team
A mid-sized environment produces millions of log entries a day. A large one produces billions. Nobody reads that, and no amount of hiring changes the arithmetic.
The work is filtering at the source. You keep the events carrying security signal and drop the ones that do not. Most environments we onboard start the same way: somebody switched on debug logging two years ago and nobody switched it off.
2. Every Source Writes a Different Format
Managing security logs across multiple systems means reconciling formats that were never designed to agree. Four log sources can describe one event in four different shapes.
A Windows event log and a Cisco syslog message disagree on field names. JSON from a Kubernetes pod and an AWS CloudTrail record disagree again. Even the definition of a username disagrees.
Normalization fixes this. It is unglamorous work that never fully finishes, because every new tool arrives with a new format behind it.
3. Retention Costs Money, and Investigations Need History
Storing a year of logs costs real money. The incidents needing a year of history are exactly the ones you cannot predict. Trim retention to control spend and you lose the ability to investigate anything slow-moving.
We have watched a team cut retention to ninety days in a budget review, then need month-seven data in the next incident. Tiered storage is the usual compromise.
Fast indexed storage covers the last thirty to ninety days, with cheaper archival storage behind it. It works, provided somebody has actually tested a restore.
4. Knowing What to Look For Is the Hardest Part
Most teams can collect logs. Far fewer can say which of yesterday's four million events deserved a look.
Search-heavy tools assume you already know what you are hunting. Behavioral baselining helps, because it flags what changed instead of what matched a rule somebody wrote last year.
Log monitoring across hybrid cloud environments gets harder, because in this case, one workload moves between platforms that log it differently.
Closing that gap without hand-writing a rule library is the problem we built Motadata ObserveOps around.
Five Best Practices for Security Log Management
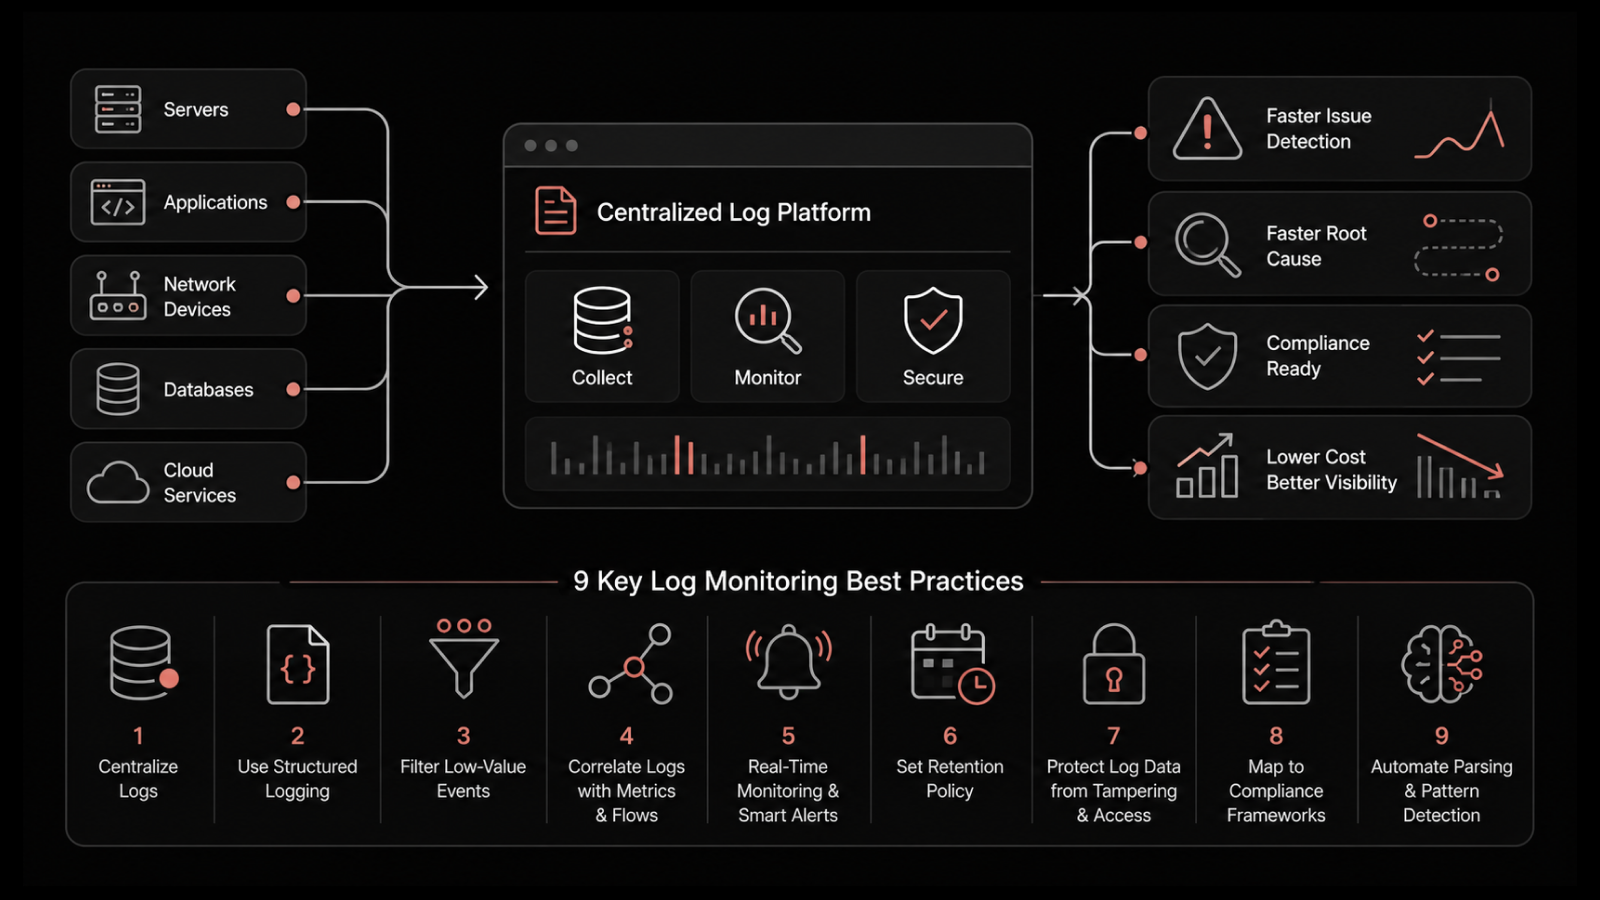
Five practices do most of the work in a log management security program. They are ordered the way we sequence them in a new deployment. Treat that order as the backbone of your log management strategy.
1. Centralize Before You Analyze
Get every log source into one platform before you spend a week on detection rules. Analysis built on partial data gives confident answers about the half of the environment you happened to instrument.
We start with domain controllers, firewalls, and anything holding regulated data. Widen from there.
2. Normalize at Collection, Not at Query Time
Parse logs into common fields as they arrive. Leave it until query time and every analyst repeats the same work under pressure, which is exactly when mistakes get made.
Pre-built parsers cover most common sources. The handful of in-house applications needing custom rules is where our implementation time actually goes.
3. Set Retention by Regulation, Not by Disk Space
Write down what each regulation requires of you, then size storage to that number. PCI DSS wants twelve months. Some sectors want considerably longer.
Deleting on schedule matters as much as keeping. Logs held past their stated retention become discoverable material you had no reason to still hold.
4. Protect the Logs Themselves
An attacker who reaches a host will try to clear its logs. Forward entries off the host as they are written, restrict who can delete from the central store, and keep a record of who searched what.
Role-based access matters here too. A log platform holds usernames, internal IP addresses, and query contents that are sensitive on their own.
5. Alert on Behavior, Not Only Thresholds
Static thresholds catch the conditions you already anticipated. Baselining catches an account that starts behaving unlike itself.
Run both, because each catches what the other misses. Thresholds handle known-bad conditions, and baselines cover what you did not think to write down. Tuning the balance is where most of the ongoing effort in log monitoring best practices actually goes.
How Motadata ObserveOps Handles Security Log Management
ObserveOps handles logs through Log Explorer. That module collects, parses, and searches log data alongside metrics and network flows.
The capabilities that carry the most weight in security work:
Inbuilt parsers: Log Explorer parses and visualizes millions of lines of log data using out-of-the-box parsers. Common sources become searchable without custom rules.
Live Tail and Surrounding Logs: You can watch logs arrive in real time, then click one entry to see the logs around it. That second one saves real time during root cause analysis.
Machine-learning pattern matching: The platform identifies patterns that indicate critical issues or threats, instead of matching only the rules you wrote yourself.
Log Collection Profiles: Each device gets a profile defining its collection protocol, log parser, runbook, collection interval, and timeout.
Search filters: Searches filter on timestamps, messages, categories, source systems, log severity, and size.
Log Forwarder: Logs can be forwarded on to other destinations when a downstream system needs a copy.
The part we lean on most is triangulation. Logs, metrics, and network flows sit in one platform. A spike in failed authentications lines up against the traffic and host behavior around it, with nothing exported to a second tool.
Compliance work is covered from two directions. Our network configuration and compliance module assesses device configurations against CIS, GDPR, HIPAA, and SOX standards. A separate audit trail records user actions inside the platform.
Alerts do not have to stop at a dashboard. ObserveOps integrates natively with Motadata ServiceOps, so a security event can raise and escalate an incident response ticket without anyone rekeying it.
Deployment matters for regulated teams. ObserveOps runs in six modes, from a single box through to high availability across a WAN. It installs on-premises, in a private cloud, or in a public cloud. Central Bank of India runs on it, which tends to be the reference that reassures banking and government buyers.
There is one honest limitation here. None of this removes the tuning work. Baselining shortens it, and our inbuilt parsers take away the worst of the setup. Somebody on your team still owns alert quality month after month.
Turn Your Logs Into Searchable Evidence With Motadata
The evidence of almost every breach exists before anyone acts on it. Some teams catch an intrusion in hours. Others hear about it from a customer. The difference is whether that evidence was collected, normalized, and searchable at the moment it counted.
None of this stands up quickly. Centralizing log sources takes longer than any vendor demo suggests. Retention costs argue with investigation needs every budget cycle. Alert tuning never finishes, and it stays a standing job on somebody's plate.
Security log management still pays for itself. A team holding ninety days of searchable, normalized history answers an incident's questions in an afternoon instead of a fortnight. Auditors get their answers without a scramble. Getting there with Motadata ObserveOps means your engineers spend that time on the next thing rather than reconstructing the last one.
FAQs
What is NIST SP 800-92, and is it still current?
NIST SP 800-92, the Guide to Computer Security Log Management, was published in 2006 and remains the final version. A revision, SP 800-92r1, has sat as a public draft since 2023. Plan against the published guidance and your own regulator's rules.
Does security log management require an agent on every server?
You do not need an agent on every server. ObserveOps collects through MotaAgent on Linux and Windows hosts where you want per-second metrics, and through configurable log collection profiles and SNMP trap monitoring elsewhere. Network appliances that cannot take an agent still forward their logs.
Can one platform handle on-premises and cloud logs together?
Yes, a single platform can cover both. ObserveOps supports on-premises, private cloud, public cloud, and hybrid environments, with documented integrations for AWS, Azure, GCP, and Microsoft 365. It also ingests OpenTelemetry data natively.
Who should own security log management, the IT team or the security team?
Both, with one named owner. Security decides which events matter and how long to keep them. IT operations owns collection coverage and platform health. Splitting ownership with no decision-maker is how log sources quietly stop reporting.
Author
Ramya Shah
Technical Writer
Ramya Shah is a technical content writer with a computer engineering background and roots in automotive journalism. He covers IT Service Management, observability, IT operations, and AI-driven automation. An early adopter of AI-assisted writing workflows, he turns complex IT processes into clear, engaging content optimized for search and answer engines (AEO), lifting content output and organic visibility.