What Is Log Aggregation? How to Design a System That Scales
Logs are easy to collect and hard to use. Most teams discover that gap after the collecting is done. Every server, container, firewall and cloud service writes its own logs, in its own format, in its own place.
Whether you can find one event across forty of them comes down to how the system was designed.
Log aggregation is where that design starts, and the choices made at log ingestion tend to follow you for years.
In this blog, you will see:
What log aggregation is, and what a log aggregation system is made of.
Where to collect logs, and how much of your estate to centralize.
What should happen to a log before it reaches an index.
Why index tiers and retention are one decision rather than two.
What changes as daily volume grows, and when aggregation stops being enough.
What Is Log Aggregation?
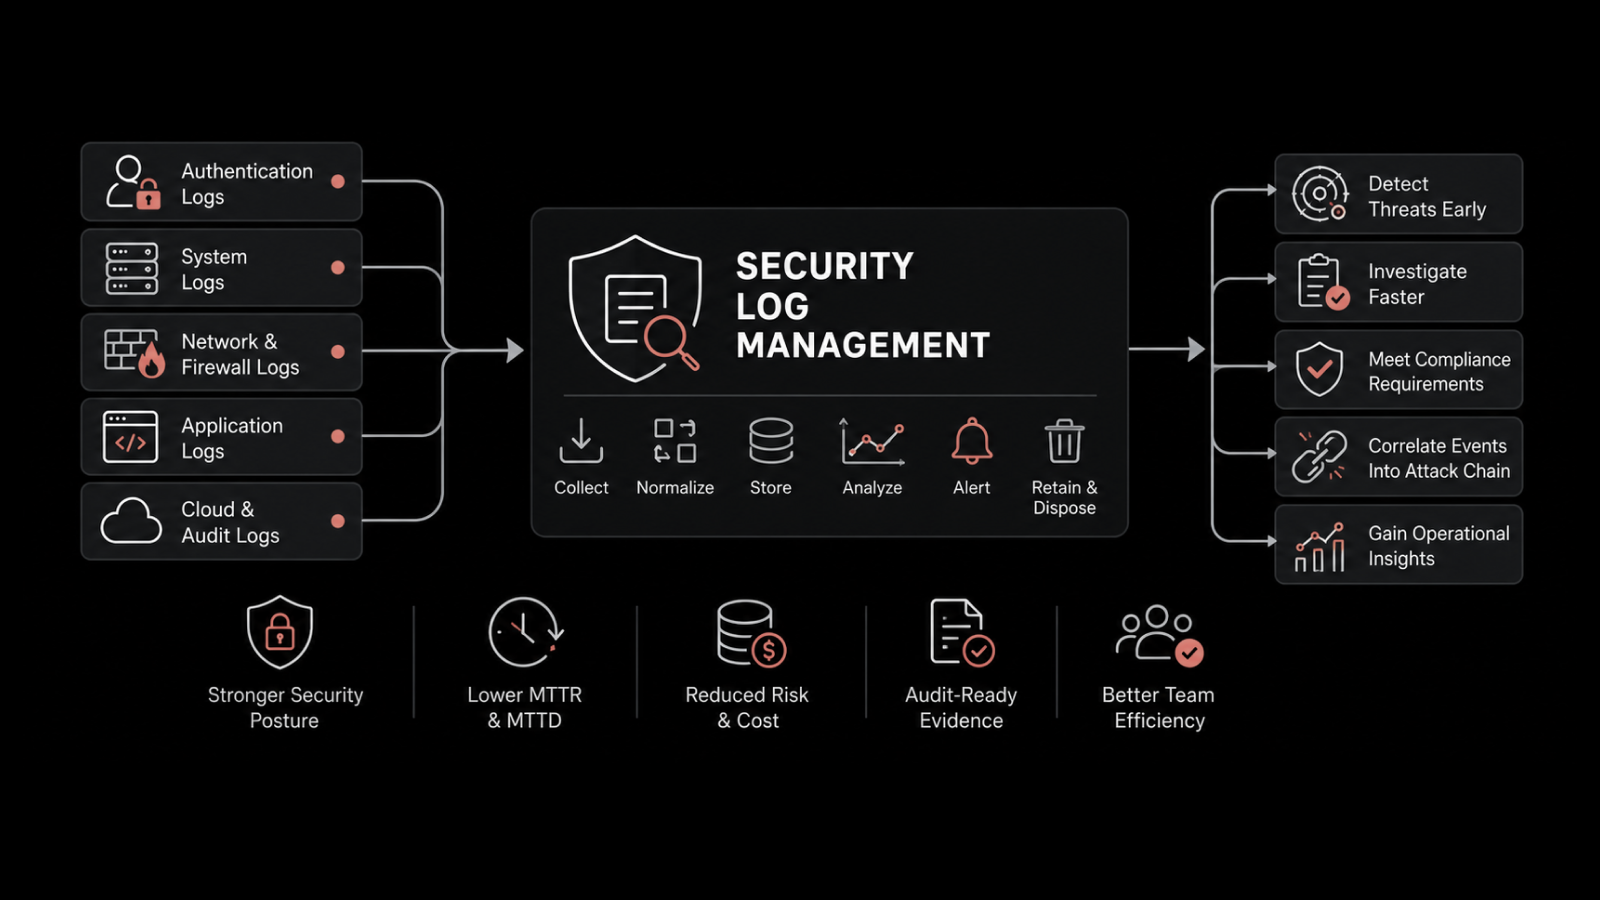
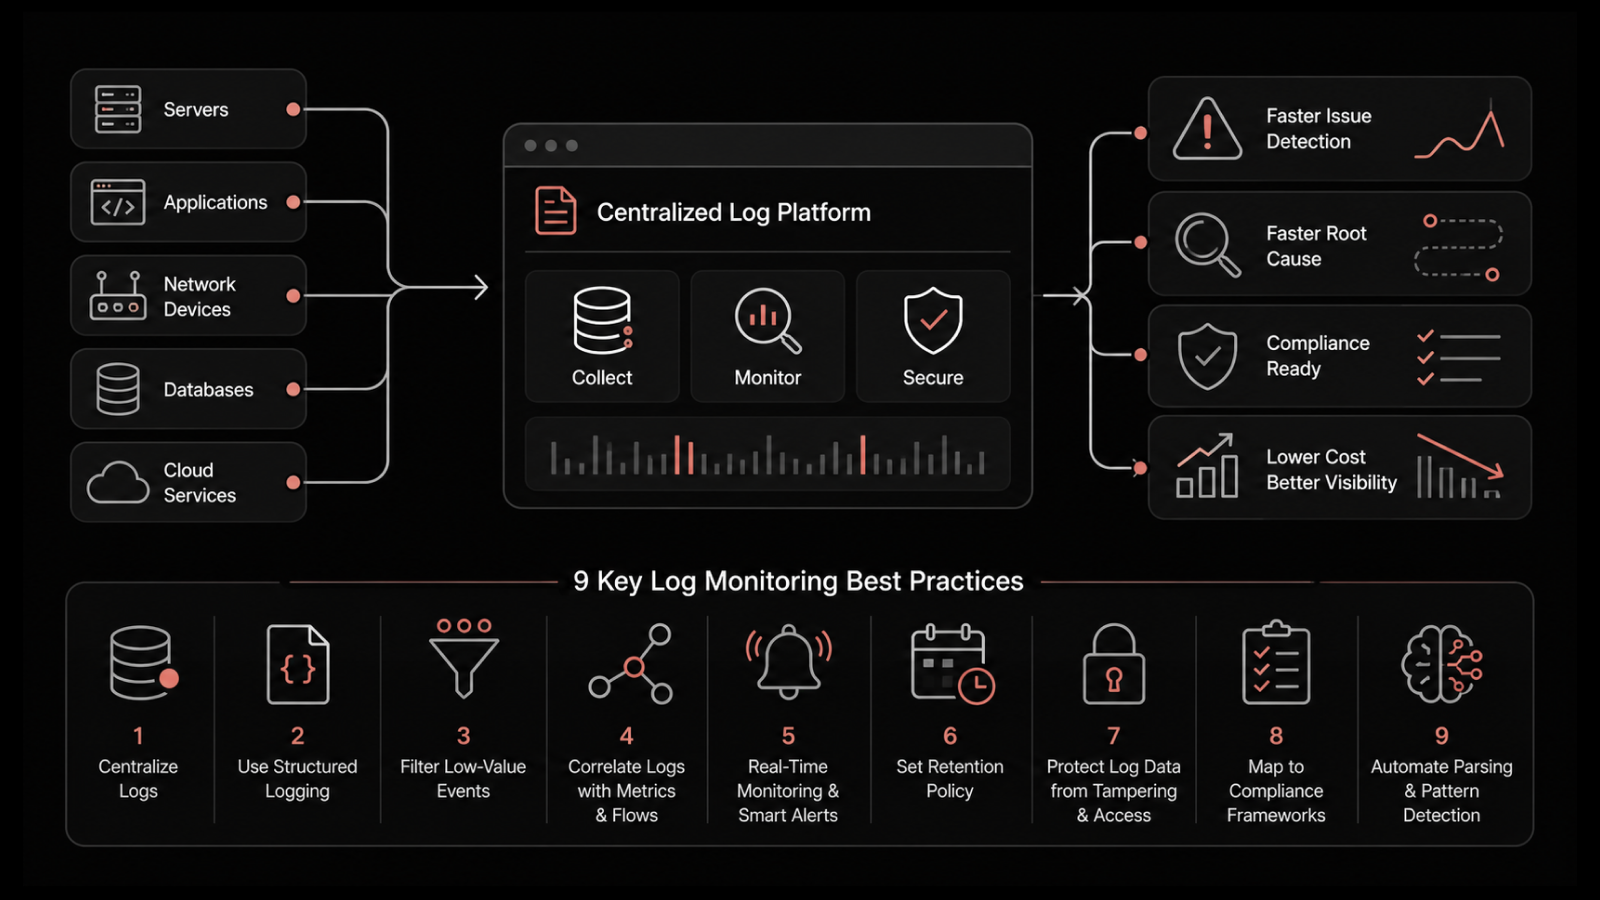
Log aggregation is the process of collecting log data from every source in an estate. All of it lands in one central place. Once it is there, you can search, correlate and analyze it as a single dataset.
Servers, applications, containers, network devices and cloud services stop keeping their logs locally. Teams aggregate logs so that one query reaches every source at once.
The word aggregation describes the act of gathering. What you end up running is a log aggregation system. That means collectors, transport, parsers, indexes and routing rules. They keep the gathering working when nobody is watching.
That difference matters more than it sounds. Aggregating logs once, by hand, during an incident is a task. Doing it continuously is another matter. Sources change every sprint. That makes it a system with design decisions attached.
The rest of a log estate sits downstream. Search, alerting, correlation and audit evidence all read what aggregation delivered. None of them can use an event that never arrived.
What Is a Log Aggregation System Made Of?
Log aggregation systems vary enormously in how they present themselves. Underneath, five components show up in every one of them, whatever the vendor calls them. Knowing the parts lets you compare two products properly. They will describe themselves in completely different language. We use these five as a checklist. Vendor diagrams often sell more than they explain.
Component | What It Does | What Happens Without It |
Collector | Reads logs at the source and moves them onward, as an agent, a receiver, or a remote poll | Sources stay isolated, and every new one is a manual job |
Transport and buffer | Carries events to the centre and absorbs bursts when they arrive faster than the centre accepts them | A deploy storm becomes lost data rather than a short delay |
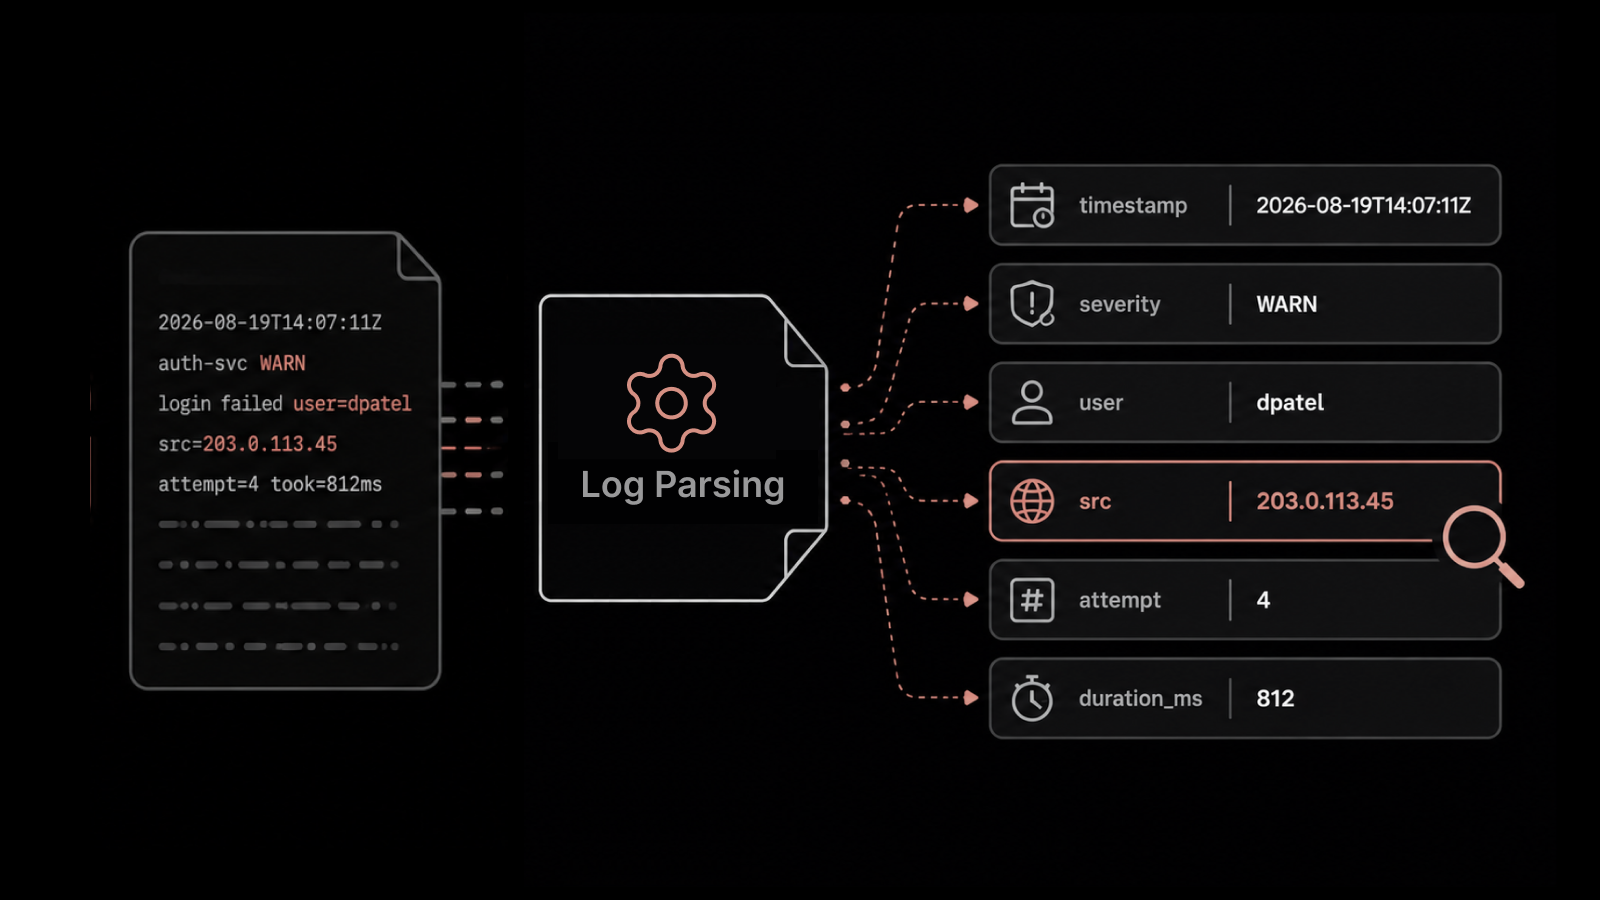
Parser | Turns raw text into named fields such as timestamp, severity and source address | You store text you cannot query, count, or alert on |
Index tiers | Makes events searchable and holds them for a defined period | Search slows as volume grows, and cost tracks volume with no ceiling |
Router | Sends a defined slice onward to an archive, a security platform, or another team | Data leaves only through an export job somebody wrote once |
Transport is the layer teams skip. It is also the one that decides whether a bad day costs you data. A collector writing straight into an index works until the index gets slow. Then events queue on the host until the disk fills.
Putting a buffer between the two changes the failure mode. A disk queue on the collector absorbs the spike. So does a message broker in the middle. The centre catches up afterwards.
We would rather see a small estate run a simple queue. A large one running none at all is the real worry.
Routing is the component people meet late. Log forwarding sends events onward to a second destination. The routing rules decide which slice each destination gets. That is what keeps a security team supplied without copying the whole stream.
What Types of Logs Do You Aggregate?
Log sources fall into four groups, and each one answers a different kind of question. Knowing which group a source belongs to is what tells you how long to keep it and who needs to see it.
System and server logs record operating system and hardware events, and they are where you look first when a host misbehaves.
Application logs carry the events your own code emits, so they explain user-facing errors that infrastructure metrics cannot.
Network logs come from routers, switches and firewalls, and they show traffic patterns, blocked connections and reachability problems.
Security logs record authentication, authorization and policy events, and they are usually the ones an auditor asks for.
The groups matter because they rarely deserve equal treatment. A staging debug line and a firewall deny event are worth very different amounts to you. Log levels are what let you route and keep them differently later.
Where Should You Collect Logs, and How?
Collection is the first real design decision. It sets how much work every future source will cost you. Four methods cover most estates, and we see most teams end up running three of the four.
1. Agent-Based Collection
An agent runs on the host, tails files, and ships events onward. It gives you the most control. That includes buffering on the host itself when the network drops. The cost is upkeep on every machine you own.
2. Agentless Remote Collection
The platform reaches out and pulls logs over an API or a remote protocol, with no software installed on the source.
This is the only option for appliances and managed services you cannot log into. It needs credentials, network reach, and a profile for each source type.
3. Syslog Receivers
Network gear and Linux daemons push over syslog to a listener you run. Nothing gets installed and almost every device supports it.
That is why syslog outlived decades of predictions about its retirement. The message body arrives as free text, so parsing work moves downstream.
4. Sidecars and Node Agents
In container estates, a sidecar collects for one pod. A node agent collects for everything on a host. Node agents scale better and see less application context. Sidecars see more, and they multiply with your workload count.
Whichever methods you pick, protect one thing above the rest. Log collection should not lock in your design. Move a source from syslog today to an agent next year, and it should land in the same place with the same fields. Nothing downstream should notice.
That matters more in split estates than it used to. According to Flexera's 2026 State of the Cloud Report, 73% of organizations now run a hybrid cloud model. Most collection designs have to span environments that were never meant to share a logging stack.
How Much Should You Centralize?
Pulling all of it into one place is the default answer. It is right more often than not. It stops being right at a certain point.
That is when distance, data residency, or blast radius start costing more than the simplicity is worth. Three shapes cover the realistic choices.
1. One central cluster
Every source ships to one place. Queries stay simple, correlation reaches everything, and there is one system to run. It is also one system to lose. Every byte crosses whatever network sits between the source and the centre.
2. Regional clusters
Each region aggregates locally. Only a summary or a defined subset travels onward. Egress costs drop, and data can stay where regulation wants it. You now run several systems, and correlation across regions takes real work.
3. Federated search
Logs stay where they land, and a query layer reaches across them. Nothing moves, which is cheap. Cross-source queries run slower, and they fail in more interesting ways.
The three shapes are easier to judge drawn out. The diagram below shows where data lands in each one, and what each costs you.
One trade-off runs through all three. Centralizing buys correlation and costs resilience. Spreading out buys resilience and costs correlation. No design escapes that. Pick the side your incidents need, then plan the other side on purpose.
Whichever shape you land on, size for the burst rather than the average. A log aggregation pipeline built for a normal Tuesday will meet a deploy storm eventually.
Whether that costs you a delay or your data comes down to one thing. Something in the middle has to be willing to hold events for a while. This is where centralized logging turns from a collection question into a capacity one.
What Should Happen Before Logs Reach the Index?
Between arrival and storage, an event passes through several stages. Each one decides what the event will be worth later. Skipping them does not save you the work. It moves the work to every future query.
Parsing comes first, turning raw text into named fields. Normalization maps those names onto one schema, so two vendors describing the same thing agree.
Enrichment then adds what the event never carried, such as the environment or the owning team. The mechanics of log parsing and how those three stages differ have their own guide.
Detection sits next. A policy might fire on severity, or on a rate over a window. Either way, those fields have to exist first. Turning recurring values into metrics happens around the same point. That is how an error rate becomes a trend rather than a pile of separate events.
Exclusion comes after all of it, and the order is on purpose. This is the stage order we end up defending most often. Drop events the moment they arrive, and nothing has measured or detected on them yet.
You lose any way of knowing what you threw away. Decide what to exclude once detection and measurement are set up. The volume still never reaches storage.
The order matters more than the names do. The diagram below shows where exclusion sits, and what has already happened to an event by the time it gets there.
The practical version is short. Write down what you need to ask in six months. Check that the stages before indexing produce those fields. Only then decide what never needs to land.
How Do Index Tiers and Retention Work Together?
Most teams treat indexing and retention as two settings. That is where the cost problem starts, and we meet that split more often than any other design mistake in a log estate.
An index is a storage tier. It carries its own filter and its own retention period, so setting one up is a single decision about what goes in and how long it stays.
Treating them separately produces a familiar bad outcome. One retention period gets applied to everything. It is either too short for the audit evidence or too expensive for the debug logs, and usually both at once.
Log indexing is what you are really paying for, because every indexed field costs storage whether anybody queries it or not. Cutting tiers by source, severity or business value fixes it.
Firewall deny events and staging debug output stop sharing a lifetime. Each tier then holds only what its own filter lets in.
How long a period should be is a separate question, and it carries real legal exposure. Log retention sets out the drivers behind it.
The design decision here is narrower and safer. You are choosing how many tiers to run, and what routes an event into each one.
What Changes as Your Log Volume Grows?
A design that works at ten gigabytes a day rarely survives at five hundred untouched. The decisions do not change. What changes is which one is currently hurting.
Early on, the only real problem is scattered logs, and getting them into one place solves it. Once a pipeline is genuinely busy, parsing consistency becomes the constraint.
A rule that matched one format quietly stops matching after a vendor update. Later still, the index bill gets noticed outside engineering. The question shifts from what you can collect to what deserves to be kept.
Spending on log management is climbing to match. According to Precedence Research, the market will grow from $3.27 billion in 2024 to $10.08 billion by 2034. The spending curve tracks the volume curve fairly closely.
At the top end, bursts and retention pull against each other hardest. A tier sized for normal traffic strains exactly when an incident makes the logs matter most.
Retention policy turns into a negotiation between three teams with different needs and one storage budget.
Here are the six decisions in one view, with the point at which each one usually needs looking at again.
Decision | Realistic Options | What It Locks In | When to Revisit |
Where you collect | Agent, agentless, syslog receiver, sidecar or node agent | How fast you can add a source type you have not met before | A new platform arrives that none of your methods reach |
How much you centralize | One cluster, regional clusters, federated search | Whether correlation across sources is cheap or deliberate work | A second region, or a sovereignty requirement |
What absorbs a burst | Nothing, a disk queue, a message broker | Whether a deploy storm costs you data or only delay | The first time ingestion falls behind during an incident |
What happens before indexing | Parse only, parse and enrich, parse then detect then exclude | What a query is able to ask six months from now | A question you cannot answer because the field was never made |
How you cut index tiers | One tier, by source, by severity or criticality | What you can afford to keep, and for how long | The index bill gets raised outside engineering |
Where logs go after storage | Nowhere, one archive, several scoped destinations | Whether you can change platform without a migration project | A second team asks for a slice of the stream |
Read the last column as a watch list. None of these need solving on day one, and all of them get more expensive to change the longer they sit.
We would revisit the buffering row first, because it is the one that turns a bad afternoon into missing evidence.
When Does Aggregation Stop Being Enough?
Aggregation answers one question well. Where is everything. It stops being enough when the question becomes what should happen to this event, and you find yourself answering that in five separate places.
The symptoms are consistent. Parsing rules live with the collectors. Detection lives in the alerting tool. Exclusion lives wherever somebody could reach it, and retention lives in a storage setting nobody has opened in a year.
Each one is defensible alone. Together they mean a single log format change breaks something owned by whoever is on leave.
An observability pipeline is the same work run as one flow instead of five. Ingestion, processing, detection, metrics, exclusion, indexing and forwarding sit as stages on one path.
A parser change then carries through to everything downstream with nothing to reconcile by hand.
That is also the point where log data stops being a separate estate. It starts behaving like the rest of a unified observability platform, where an event can be read next to the metric or the trace around it.
We built Motadata ObserveOps Log Monitoring around that shape. Syslog, Windows Event Log, agents, forwarders and agentless profiles all converge onto one path.
Exclusion sits after detection and metrics rather than at the front door. Each index is a tier carrying its own filter and its own retention period.
None of that removes the six decisions above. It moves them somewhere they can be changed together. That is a different promise from removing them, and a more honest one.
Design the System Before You Pick the Product
Log aggregation looks like a collection problem and behaves like a design problem. The six decisions above outlast whatever product you run them on, and each one gets more expensive to reverse the longer it stays unexamined.
None of this is free. Every stage you add before indexing costs CPU in the hot path, and every tier you cut adds a routing rule somebody has to maintain. Simplicity has real value, so add structure where a question you actually ask depends on it.
Start by writing down what you need to be able to ask during your next incident, then check whether today's design can answer it.
Once the design is settled, choosing between log aggregation tools becomes a much shorter conversation, because you already know what you are asking them to do.
FAQs
What is the difference between log aggregation and a SIEM?
Aggregation collects logs into one searchable place. A SIEM adds security detection rules, threat correlation and compliance reporting on top of that data. Most SIEMs aggregate, but aggregation on its own carries no security analytics.
How much log data can one log aggregation server handle?
Throughput depends on parsing complexity and indexing settings far more than raw event count. A single node handles a small estate comfortably. Sustained high volume needs horizontal scaling and a buffer in front, rather than a larger single machine.
Is syslog enough for log aggregation on its own?
Syslog handles transport well and almost every network device supports it. It does not parse, enrich, route or retain anything. Treat it as one collection method feeding a wider system, not as the system itself.
How does log aggregation support security investigations?
Investigations follow an actor across systems, which only works when events from different sources share field names and one timeline. Aggregation plus normalization delivers that, turning three separate searches into one query across every source.
Do you need to aggregate every log your systems produce?
Collect broadly, then decide what to keep. Aggregating widely costs little at the collection stage, and the expensive decisions happen at indexing and retention. Excluding at the source removes evidence you cannot recover later.
Author
Ramya Shah
Technical Writer
Ramya Shah is a technical content writer with a computer engineering background and roots in automotive journalism. He covers IT Service Management, observability, IT operations, and AI-driven automation. An early adopter of AI-assisted writing workflows, he turns complex IT processes into clear, engaging content optimized for search and answer engines (AEO), lifting content output and organic visibility.